Tachycardia, S1Q3T3, tall P wave in II, ST elevation in right-sided leads (aVR, V1, III), right axis deviation, new right bundle branch block, new incomplete right bundle branch block, and T wave inversions especially in the inferior and right-sided precordial leads (II, III, aVF, V1, V2, and V3) have all been suggested as right heart strain patterns.
Right Heart Strain

Examples
Right Heart Strain
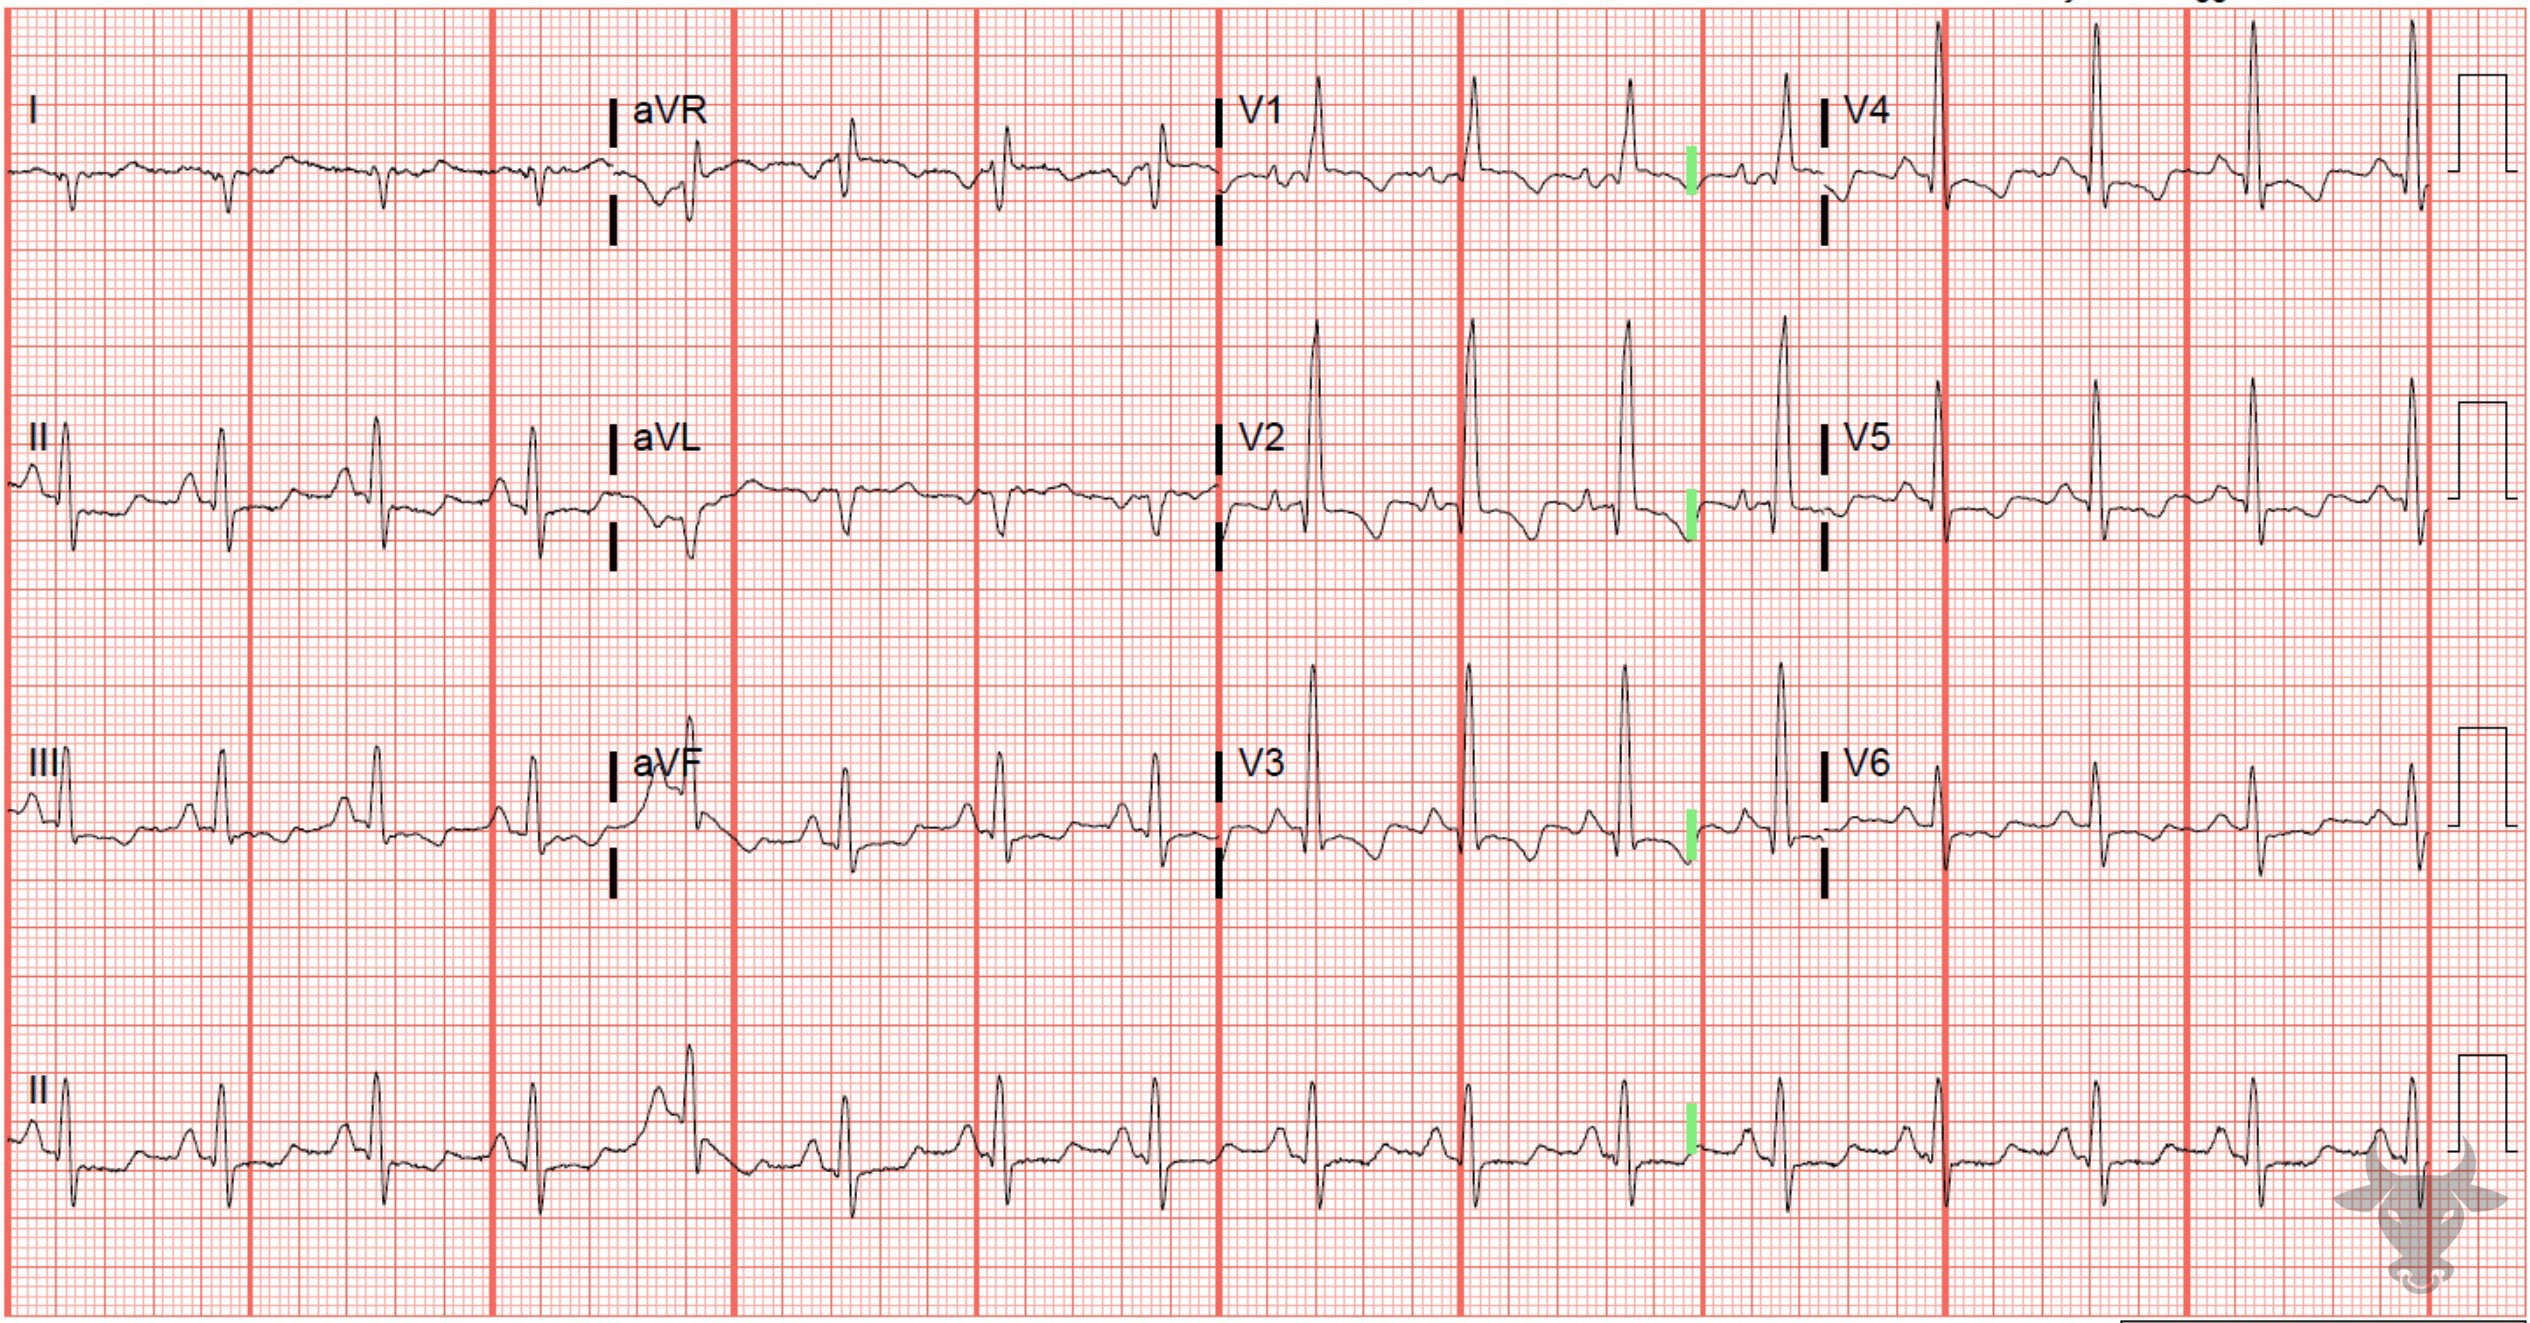
This patient was discovered to have a pulmonary embolism with right heart strain. The ECG demonstrates early R wave progression, right axis deviation, right atrial enlargement, ST-segment depressions and T-wave inversions in inferolateral leads – all consistent with right heart strain.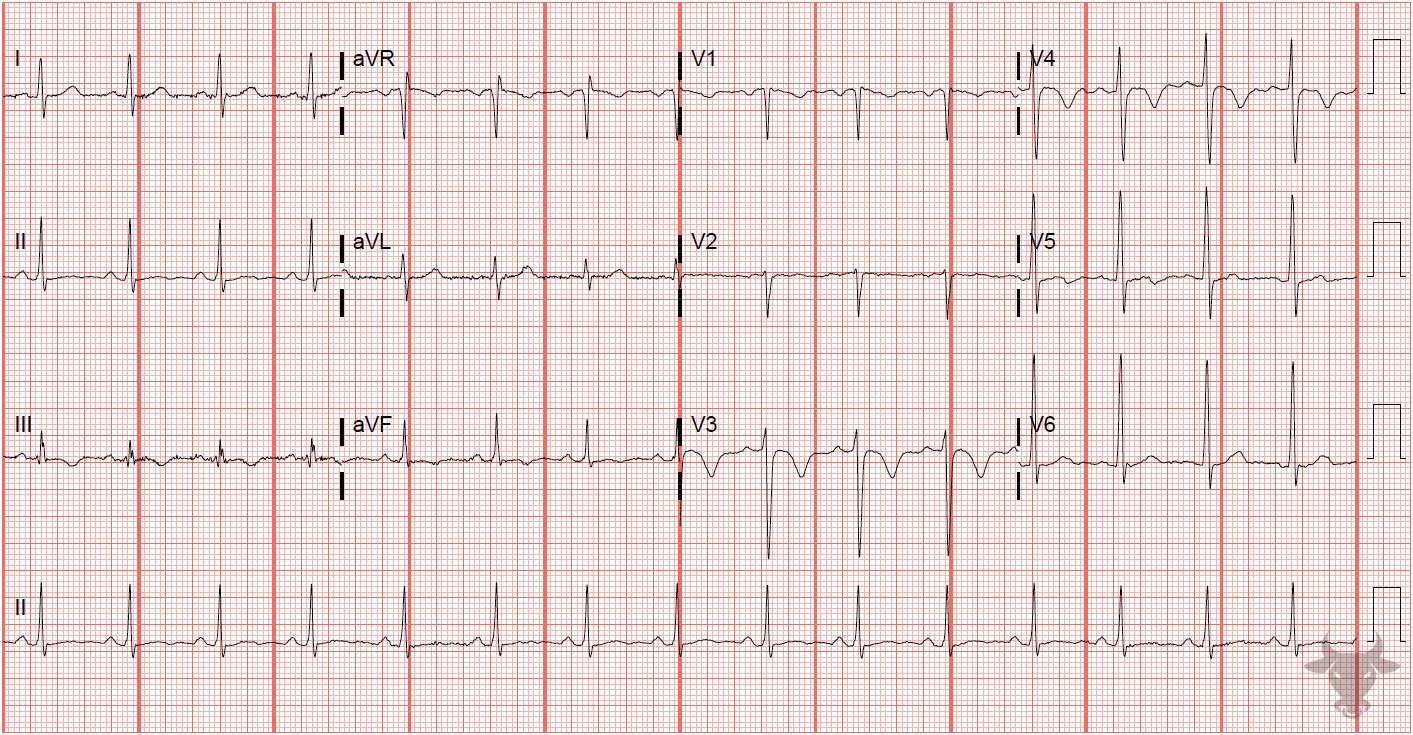
Right Heart Strain
Anterior precordial and inferior T-wave inversions are common findings of acute right heart strain. This patient had a submassive pulmonary embolism.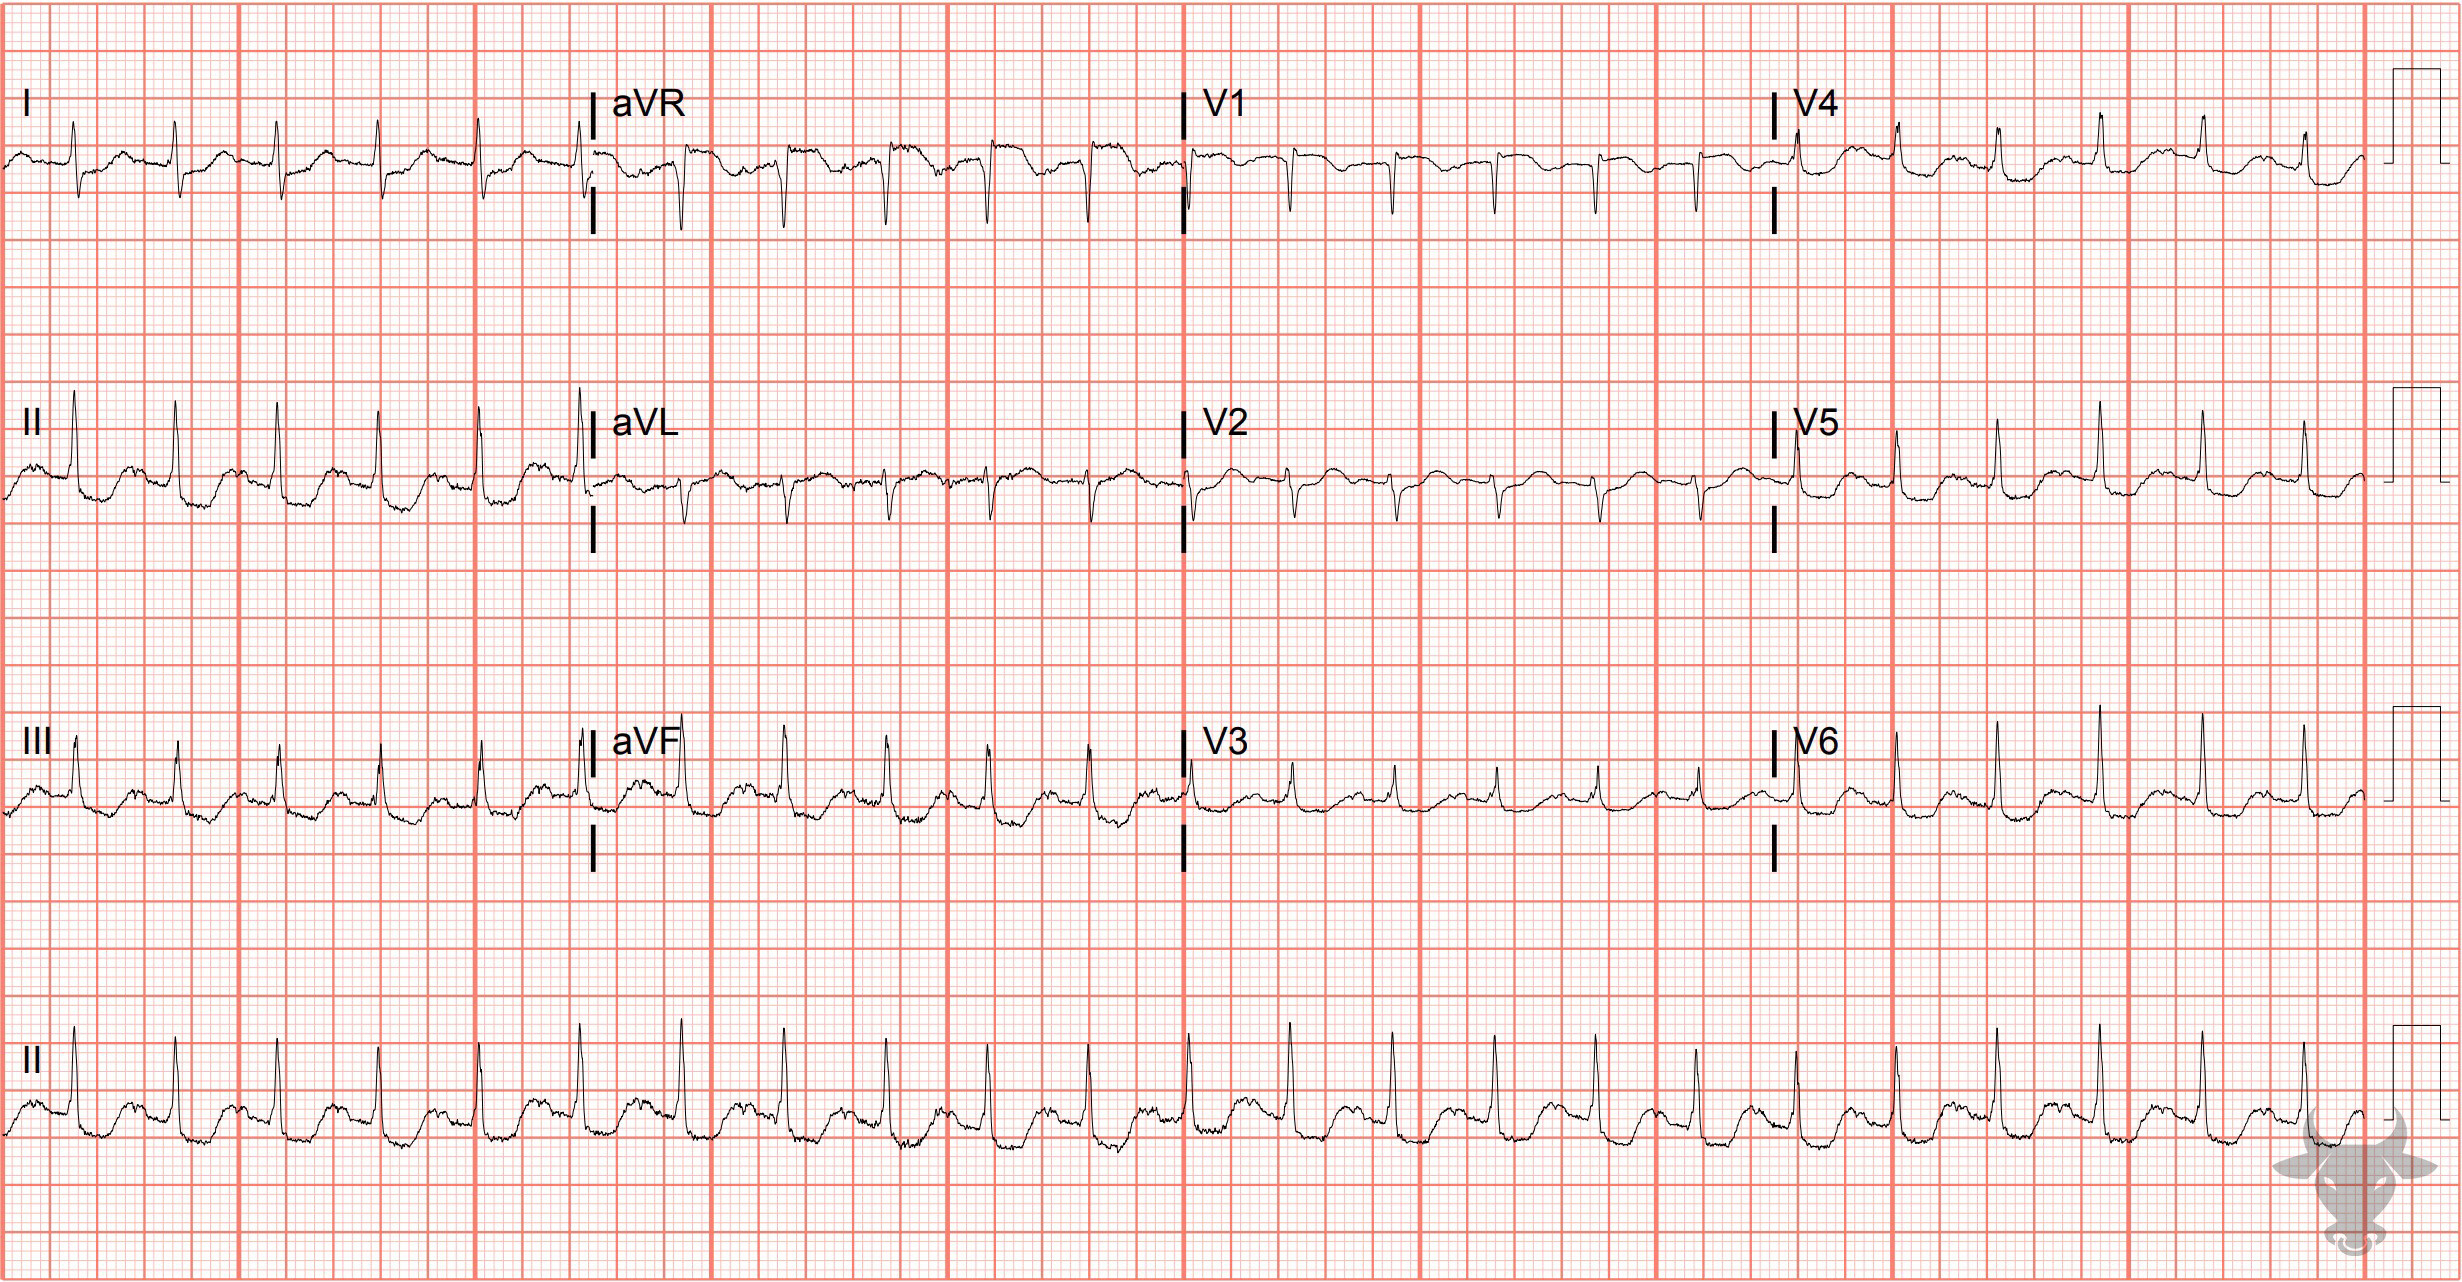
Global Subendocardial Ischemia Due to Pulmonary Embolism
There are diffuse ST-segment depressions along with ST-segment elevation in aVR. This patient was discovered to have a saddle pulmonary embolism for which thrombectomy was performed. The ST changes and tachycardia resolved after mechanical retrieval of the embolus.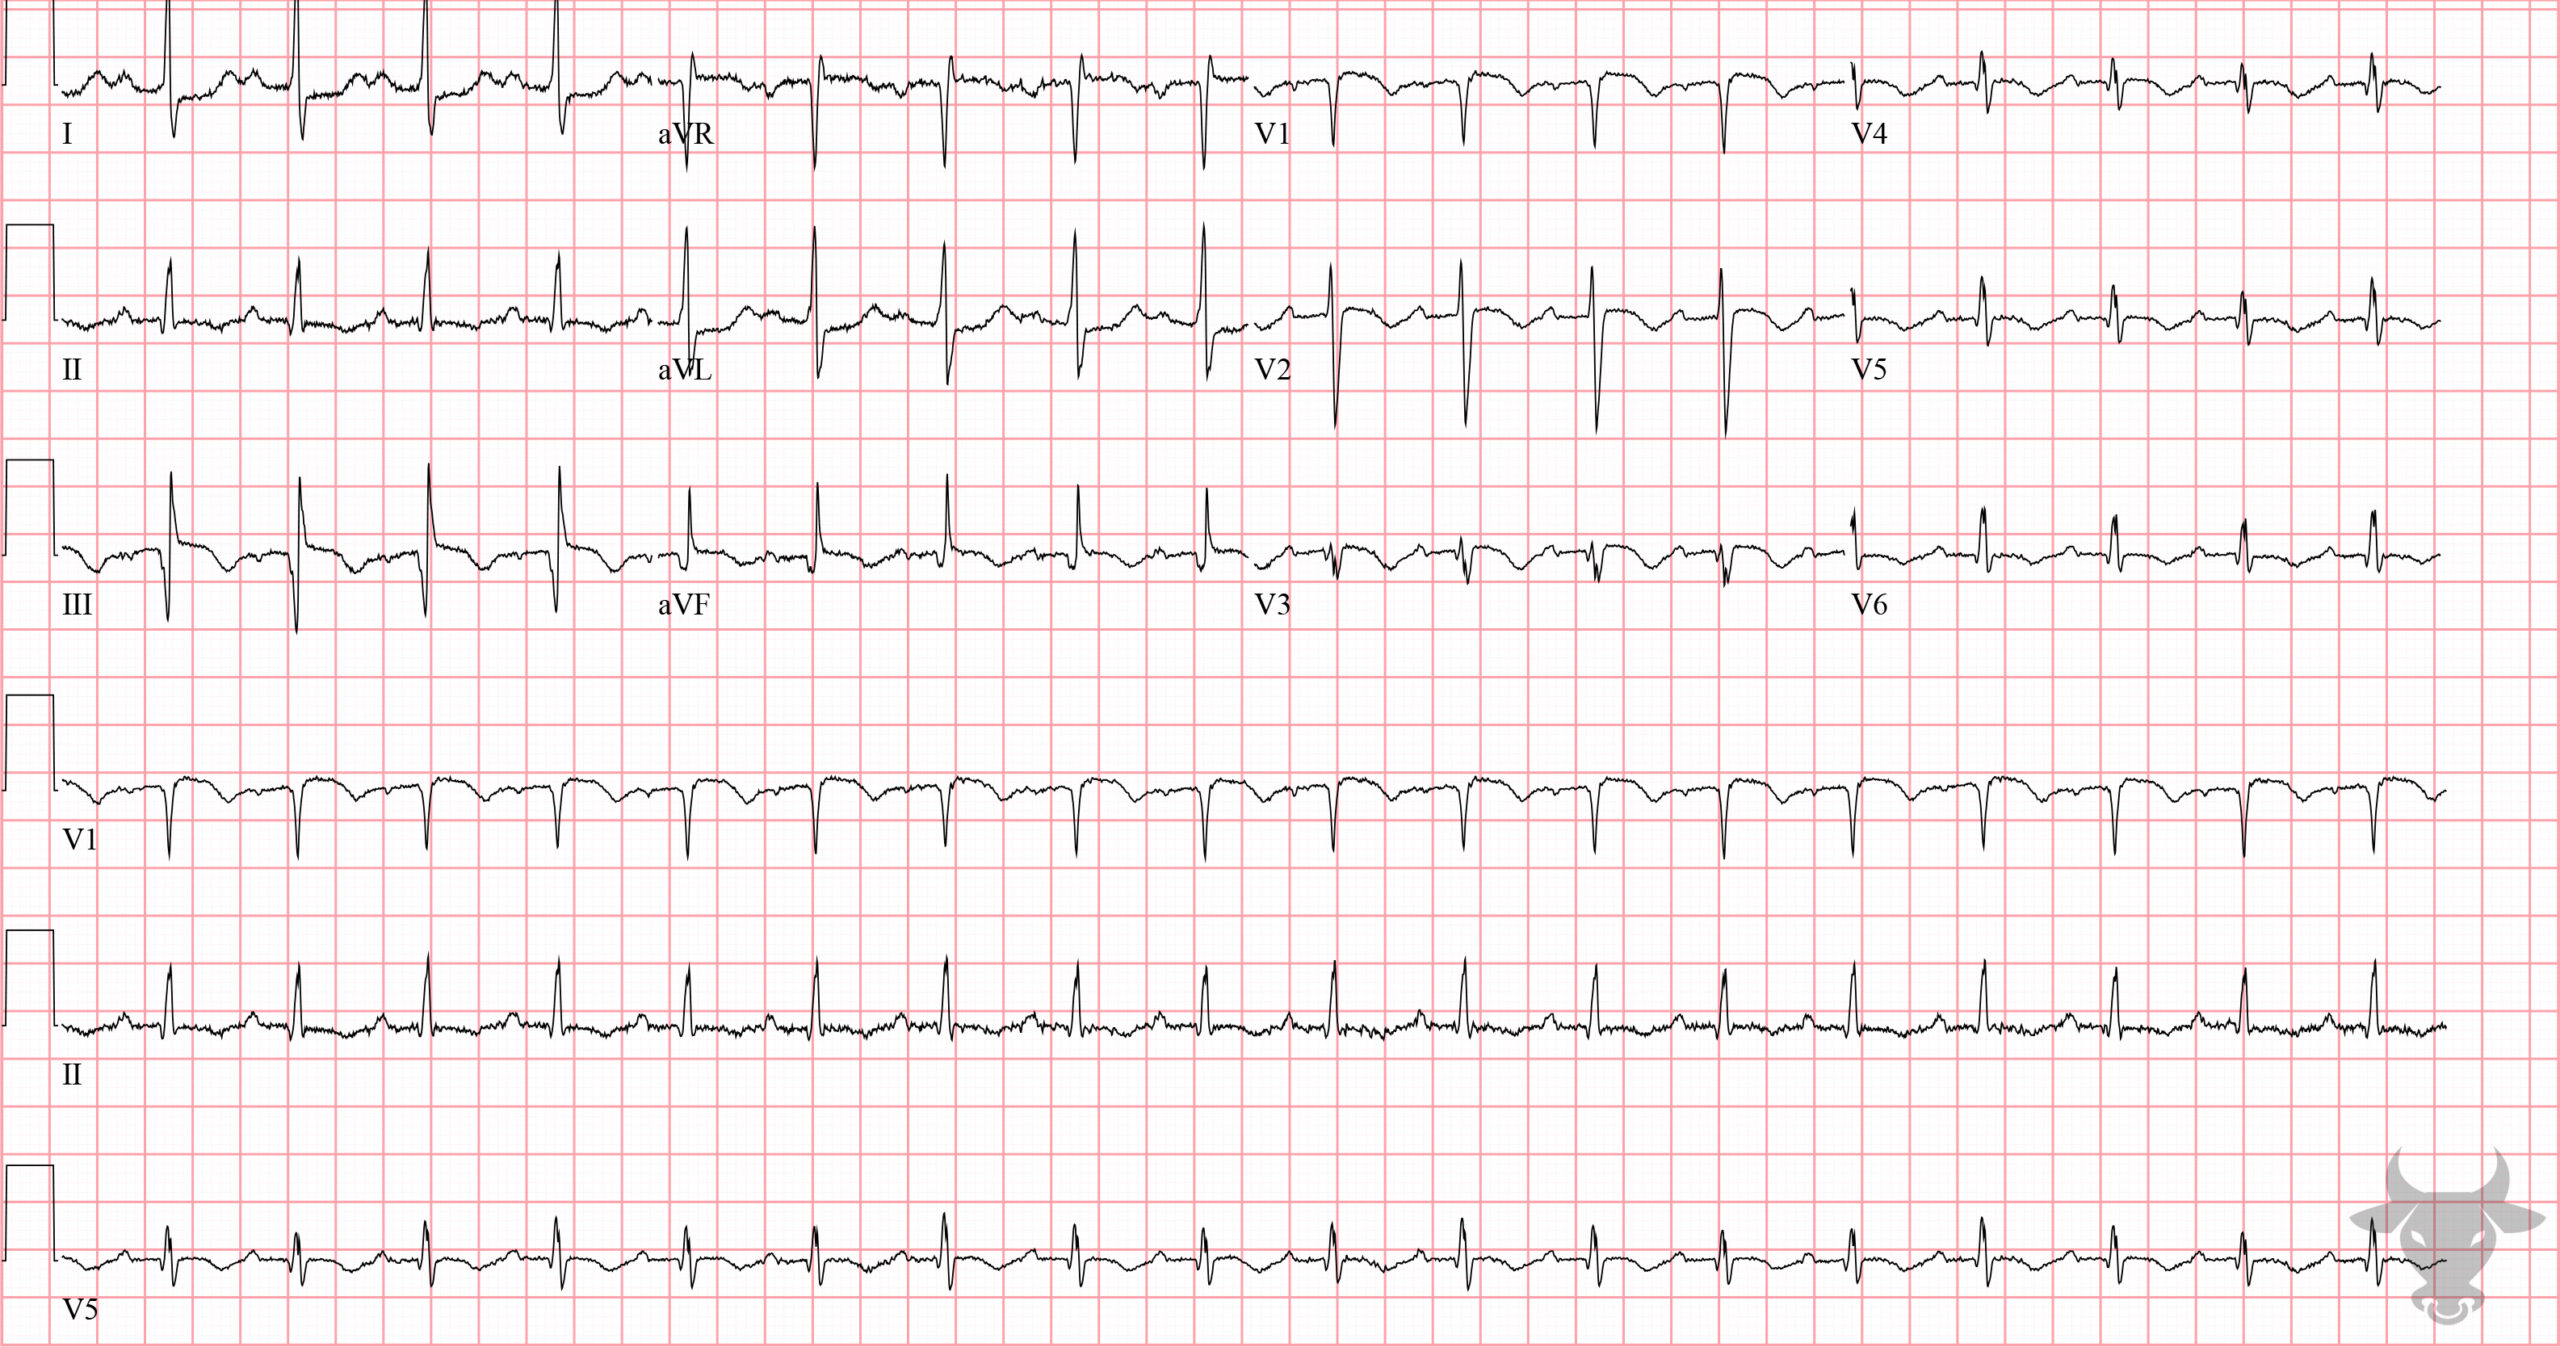
Pulmonary Embolism Masquerading as Inferior Myocardial Infarction
Massive pulmonary embolism can masquerade as right ventricular infarct, as with this case. There is subtle inferior ST-segment elevation with reciprocal ST-segment depression in I and aVL, S1Q3T3, and T-wave inversions across the precordium. Saddle and lobar pulmonary emboli were diagnosed on CT angiography.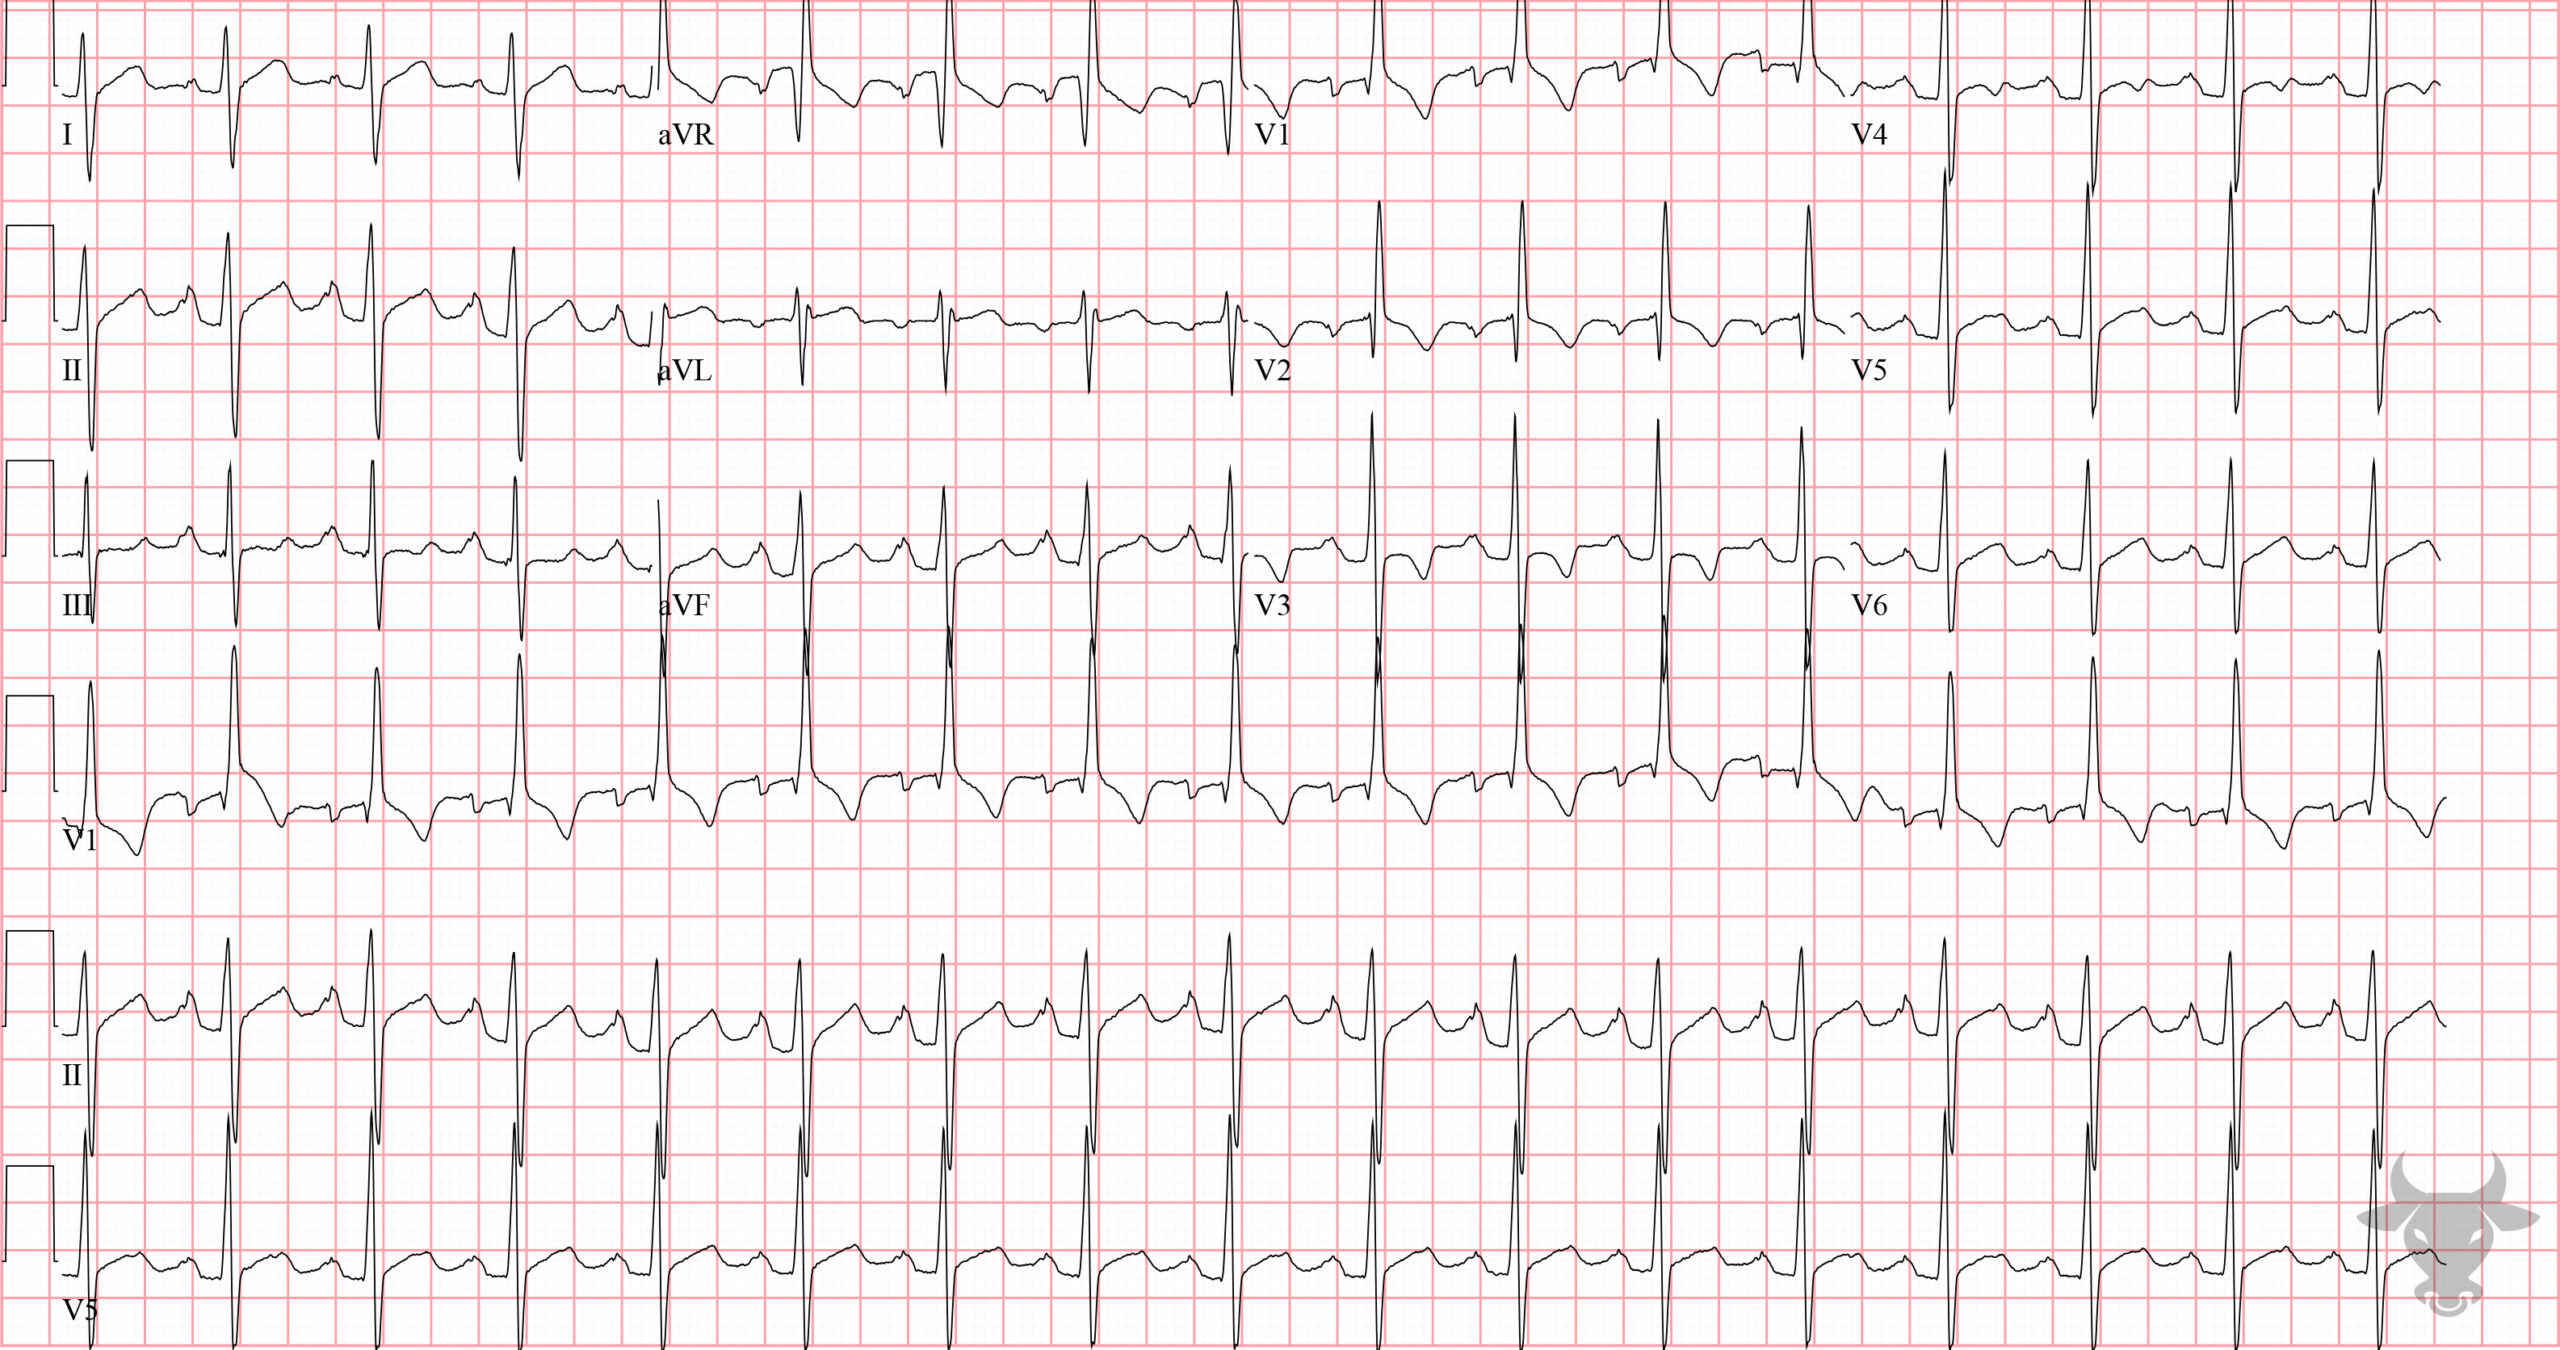
Right Ventricular Hypertrophy, Right Atrial Enlargement
Rightward forces predominate in this ECG taken from a patient with known chronic thromboembolic pulmonary hypertension. The extreme right axis deviation, tall P wave in lead II, anterior precordial T-wave inversions, and tall R wave in V1 are all findings of right heart strain. The qR patter in V1 is one of the most specific signs of severe right ventricular hypertrophy.References
- Surawicz B, Knilans TK. Chou’s Electrocardiography in Clinical Practice. 6th ed. Elsevier; 2008.