Poor R wave progression is a non-specific finding that is suggestive of prior anterior myocardial infarction. It is a poorly defined term that implies diminished amplitude of the R wave in the precordium. It has been defined as an R wave less than 3 mm in lead V3 or decreasing R wave amplitude from V2 to V3 or V3 to V4. Poor R wave progression has been implicated in left ventricular hypertrophy, right ventricular hypertrophy and can be a normal variant.
Poor R-wave Progression

Examples
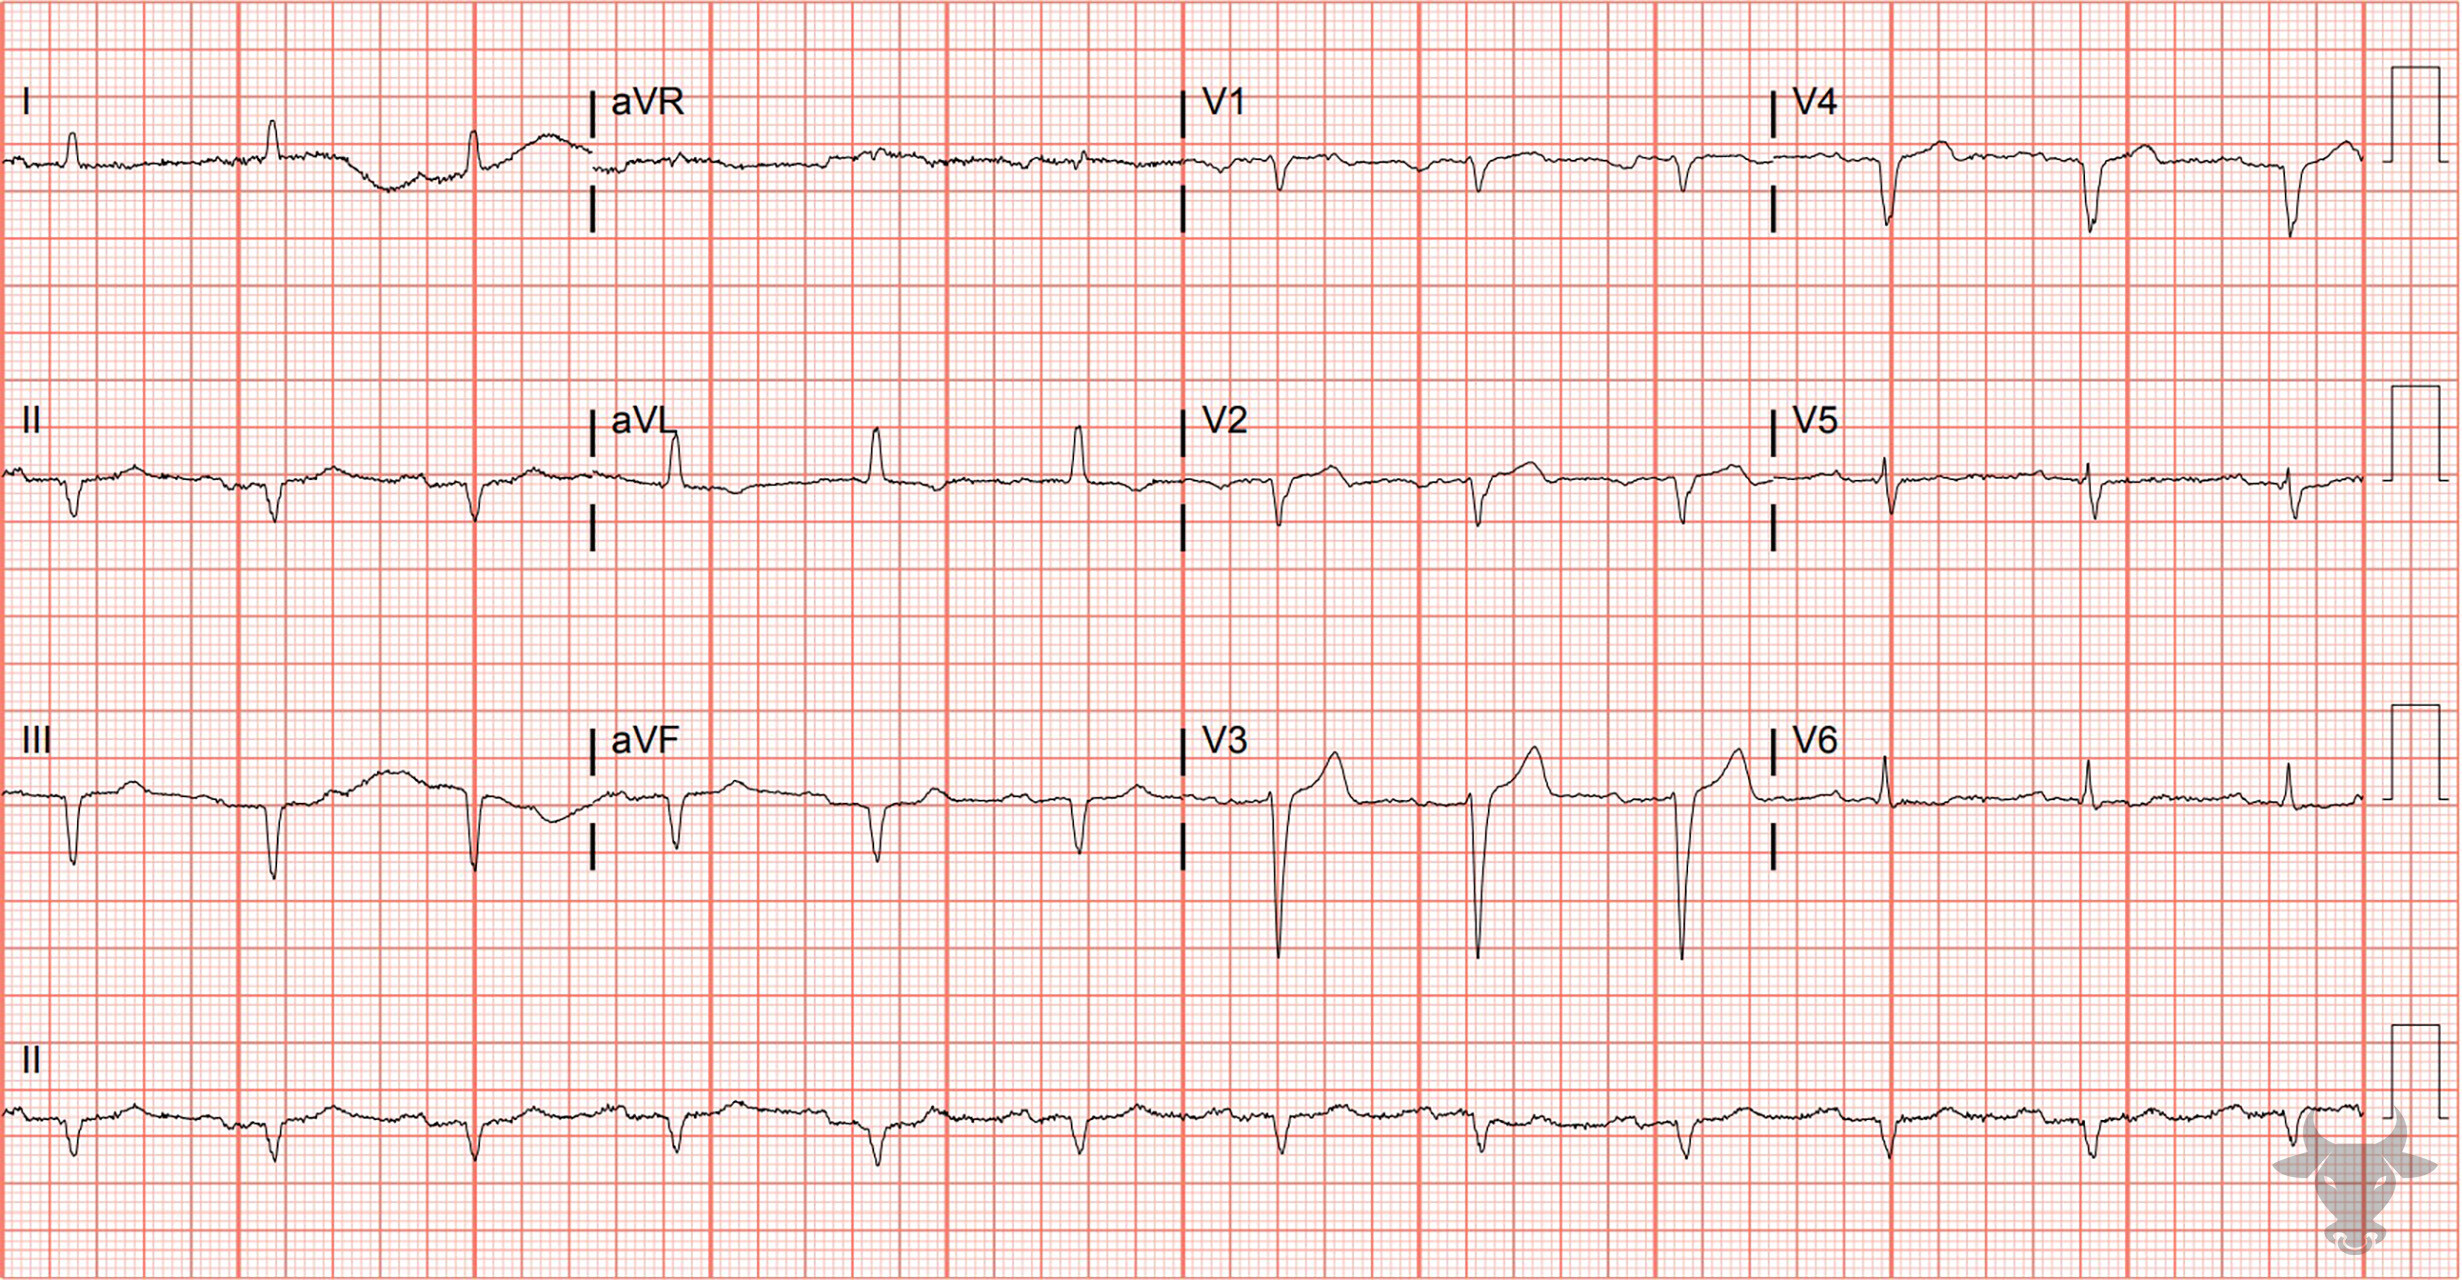
Poor R Wave Progression
There is poor R wave progression and Q waves in the inferior leads. This patient had prior myocardial infarctions in both the anterior and inferior distributions.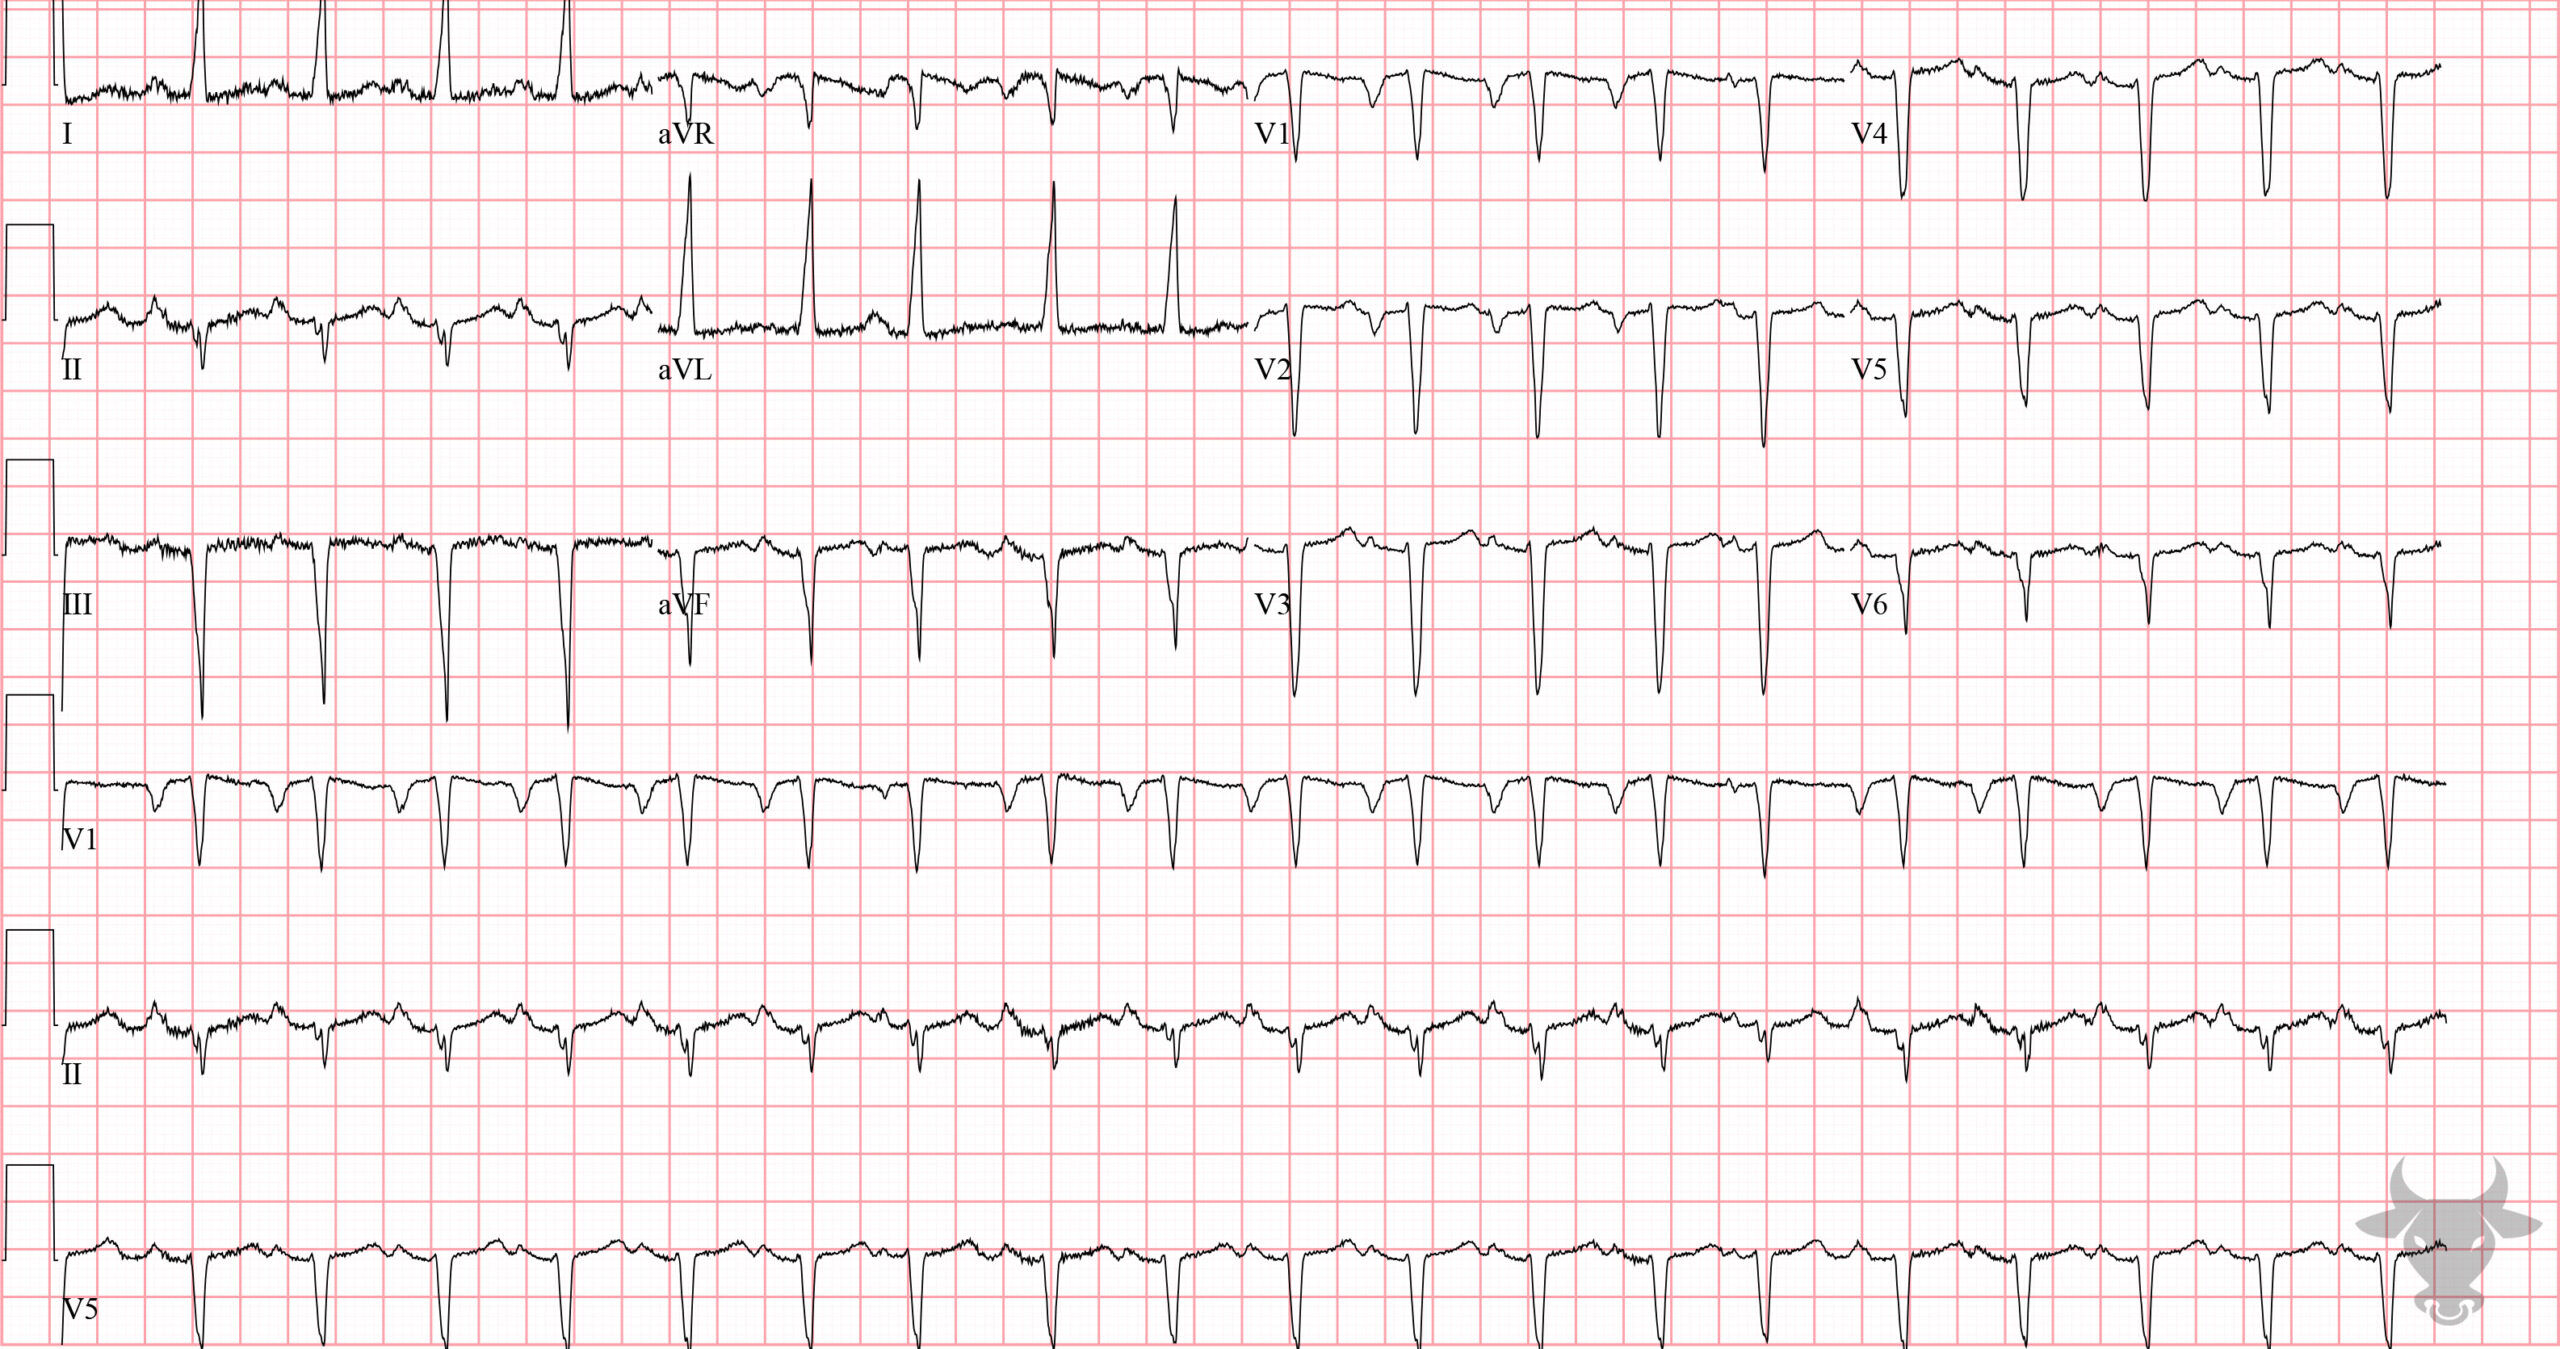
Left Ventricular Hypertrophy
A large QRS complex in aVL (greater than 11 mm) indicates left ventricular hypertrophy. The left axis deviation, slight intraventricular conduction delay, and absent R wave progression across the precordium are all likely explained by left ventricular hypertrophy. The large, downward deflected P wave in V1 and wide P wave in lead II (greater than 120 ms) indicates left atrial enlargement.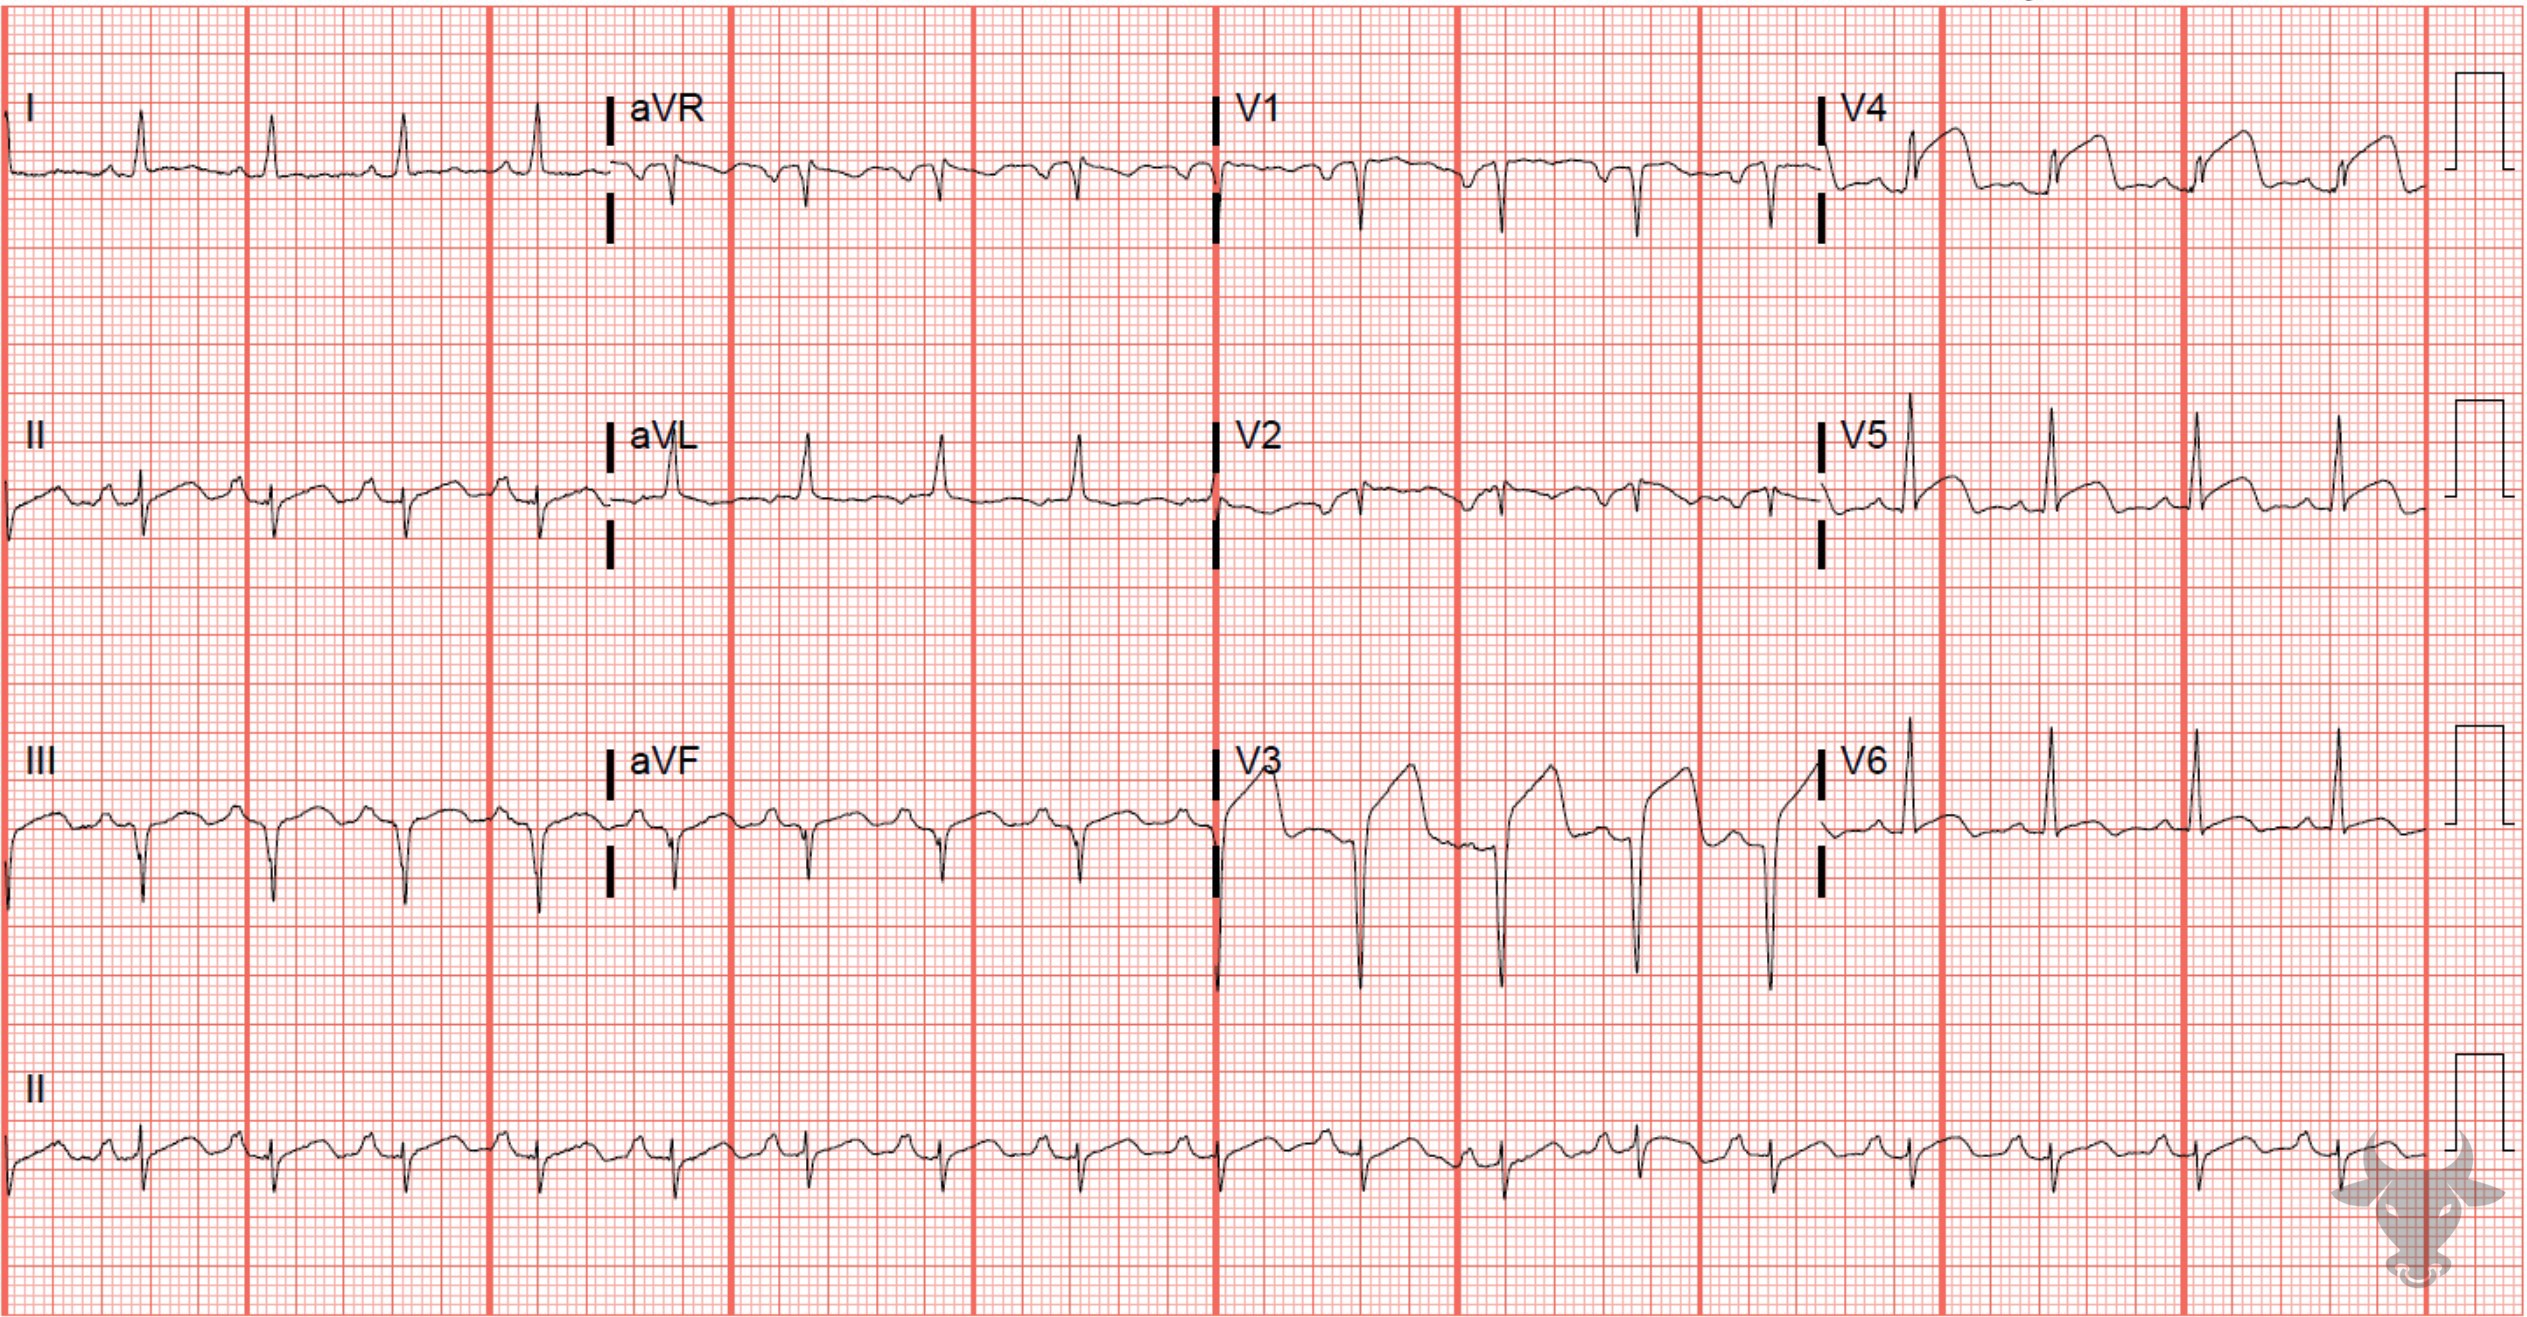
Anterior ST-elevation Myocardial Infarction
Anterior STEMI with concave morphology in V3-5 and poor R wave progression. Anterior STEMIs often do not have reciprocal ST-segment depressions as with this case. This patient received percutaneous coronary intervention of an occluded left anterior descending artery.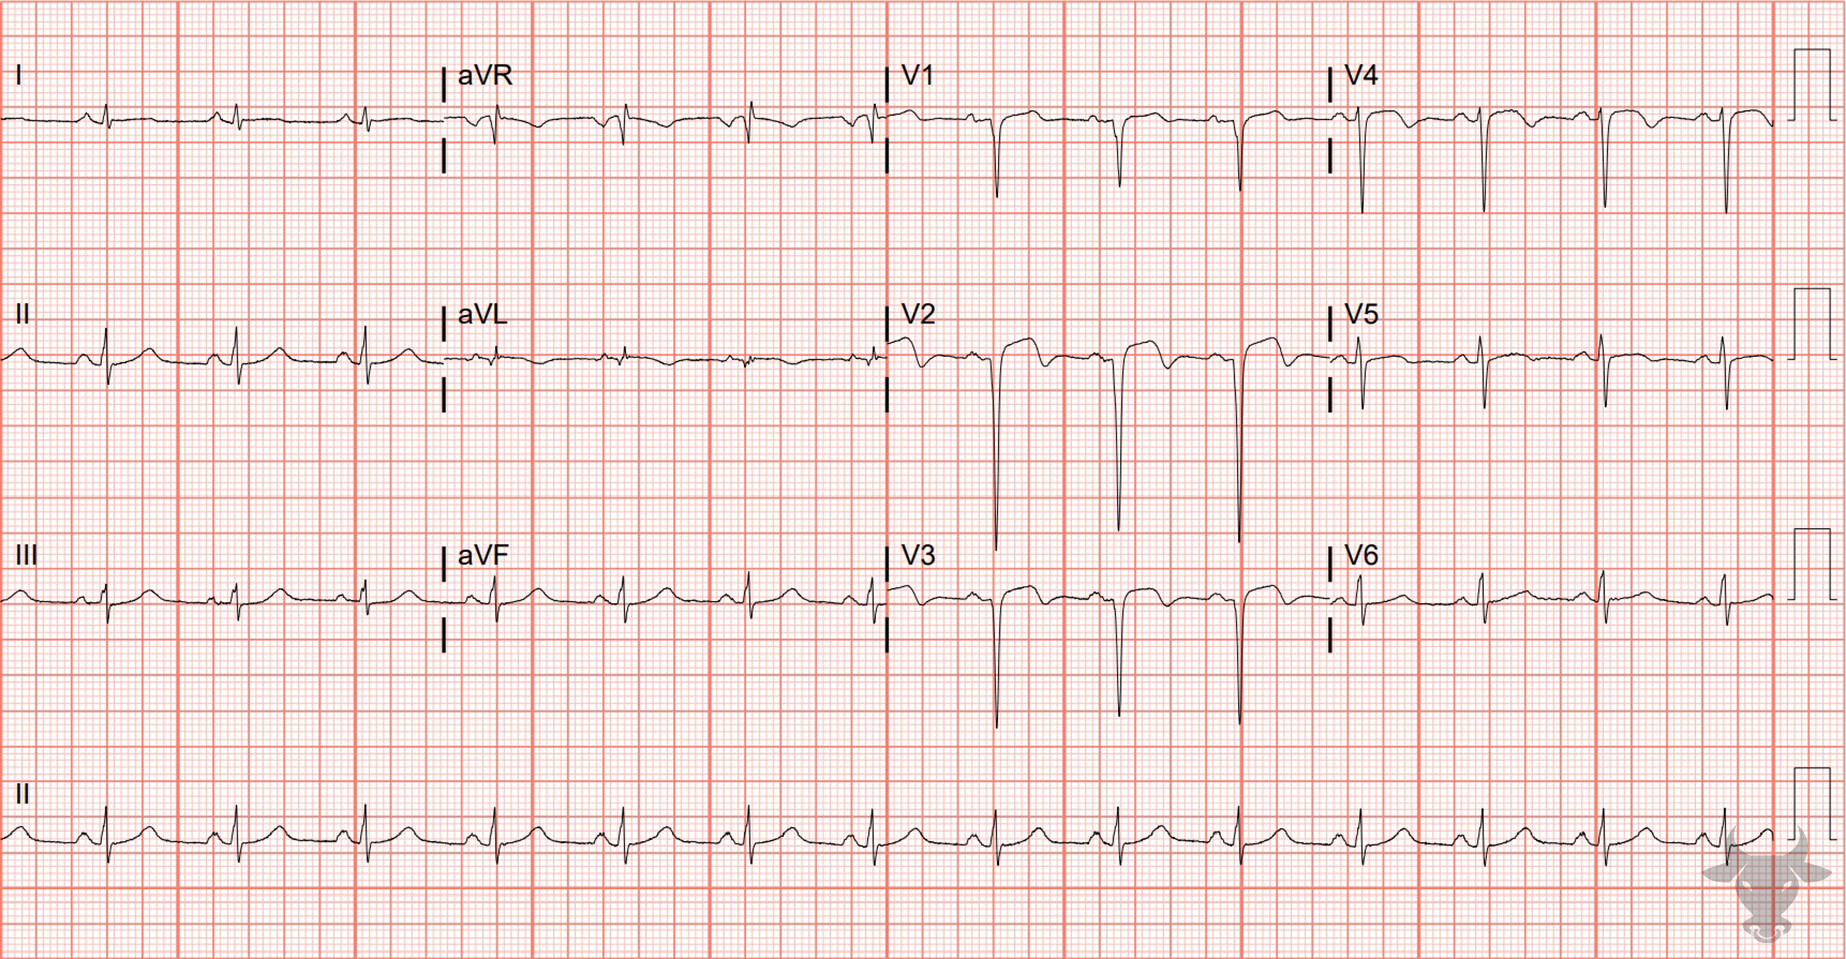
Left Ventricular Aneurysm
Large Q waves in the anterior precordial leads with associated ST-segment depression (consistent with prior ECGs) is consistent with anterior left ventricular aneurysm, confirmed via echocardiography.References
1. Zema MJ, Kligfield P. ECG Poor R-Wave Progression: Review and Synthesis. Arch Intern Med. 1982;142(6):1145-1148. doi:10.1001/ARCHINTE.1982.00340190101018
2. Surawicz B, Knilans TK. Chou’s Electrocardiography in Clinical Practice. 6th ed. Elsevier; 2008.