Hyperacute T waves are seen early in occlusive myocardial infarction and are characterized by a broad base and rounded top; they are large in amplitude when compared to the QRS complex. In 2008, deWinter described a pattern of ST depressions and hyperacute, or “rocket” T waves in the precordial leads that indicated proximal left anterior descending occlusion. The pattern was initially described as static but has since been described as dynamic, too. It is believed to occur in about 2% of anterior myocardial infarctions. deWinter T waves have been described in myocarditis where the phenomenon is consistent with general myocardial injury rather than coronary occlusion.
Hyperacute T Waves

Examples
Hyperacute T Waves
Notice that the amplitude of the T waves exceeds that of the QRS complexes in some leads. This patient had a completely occluded left anterior descending artery.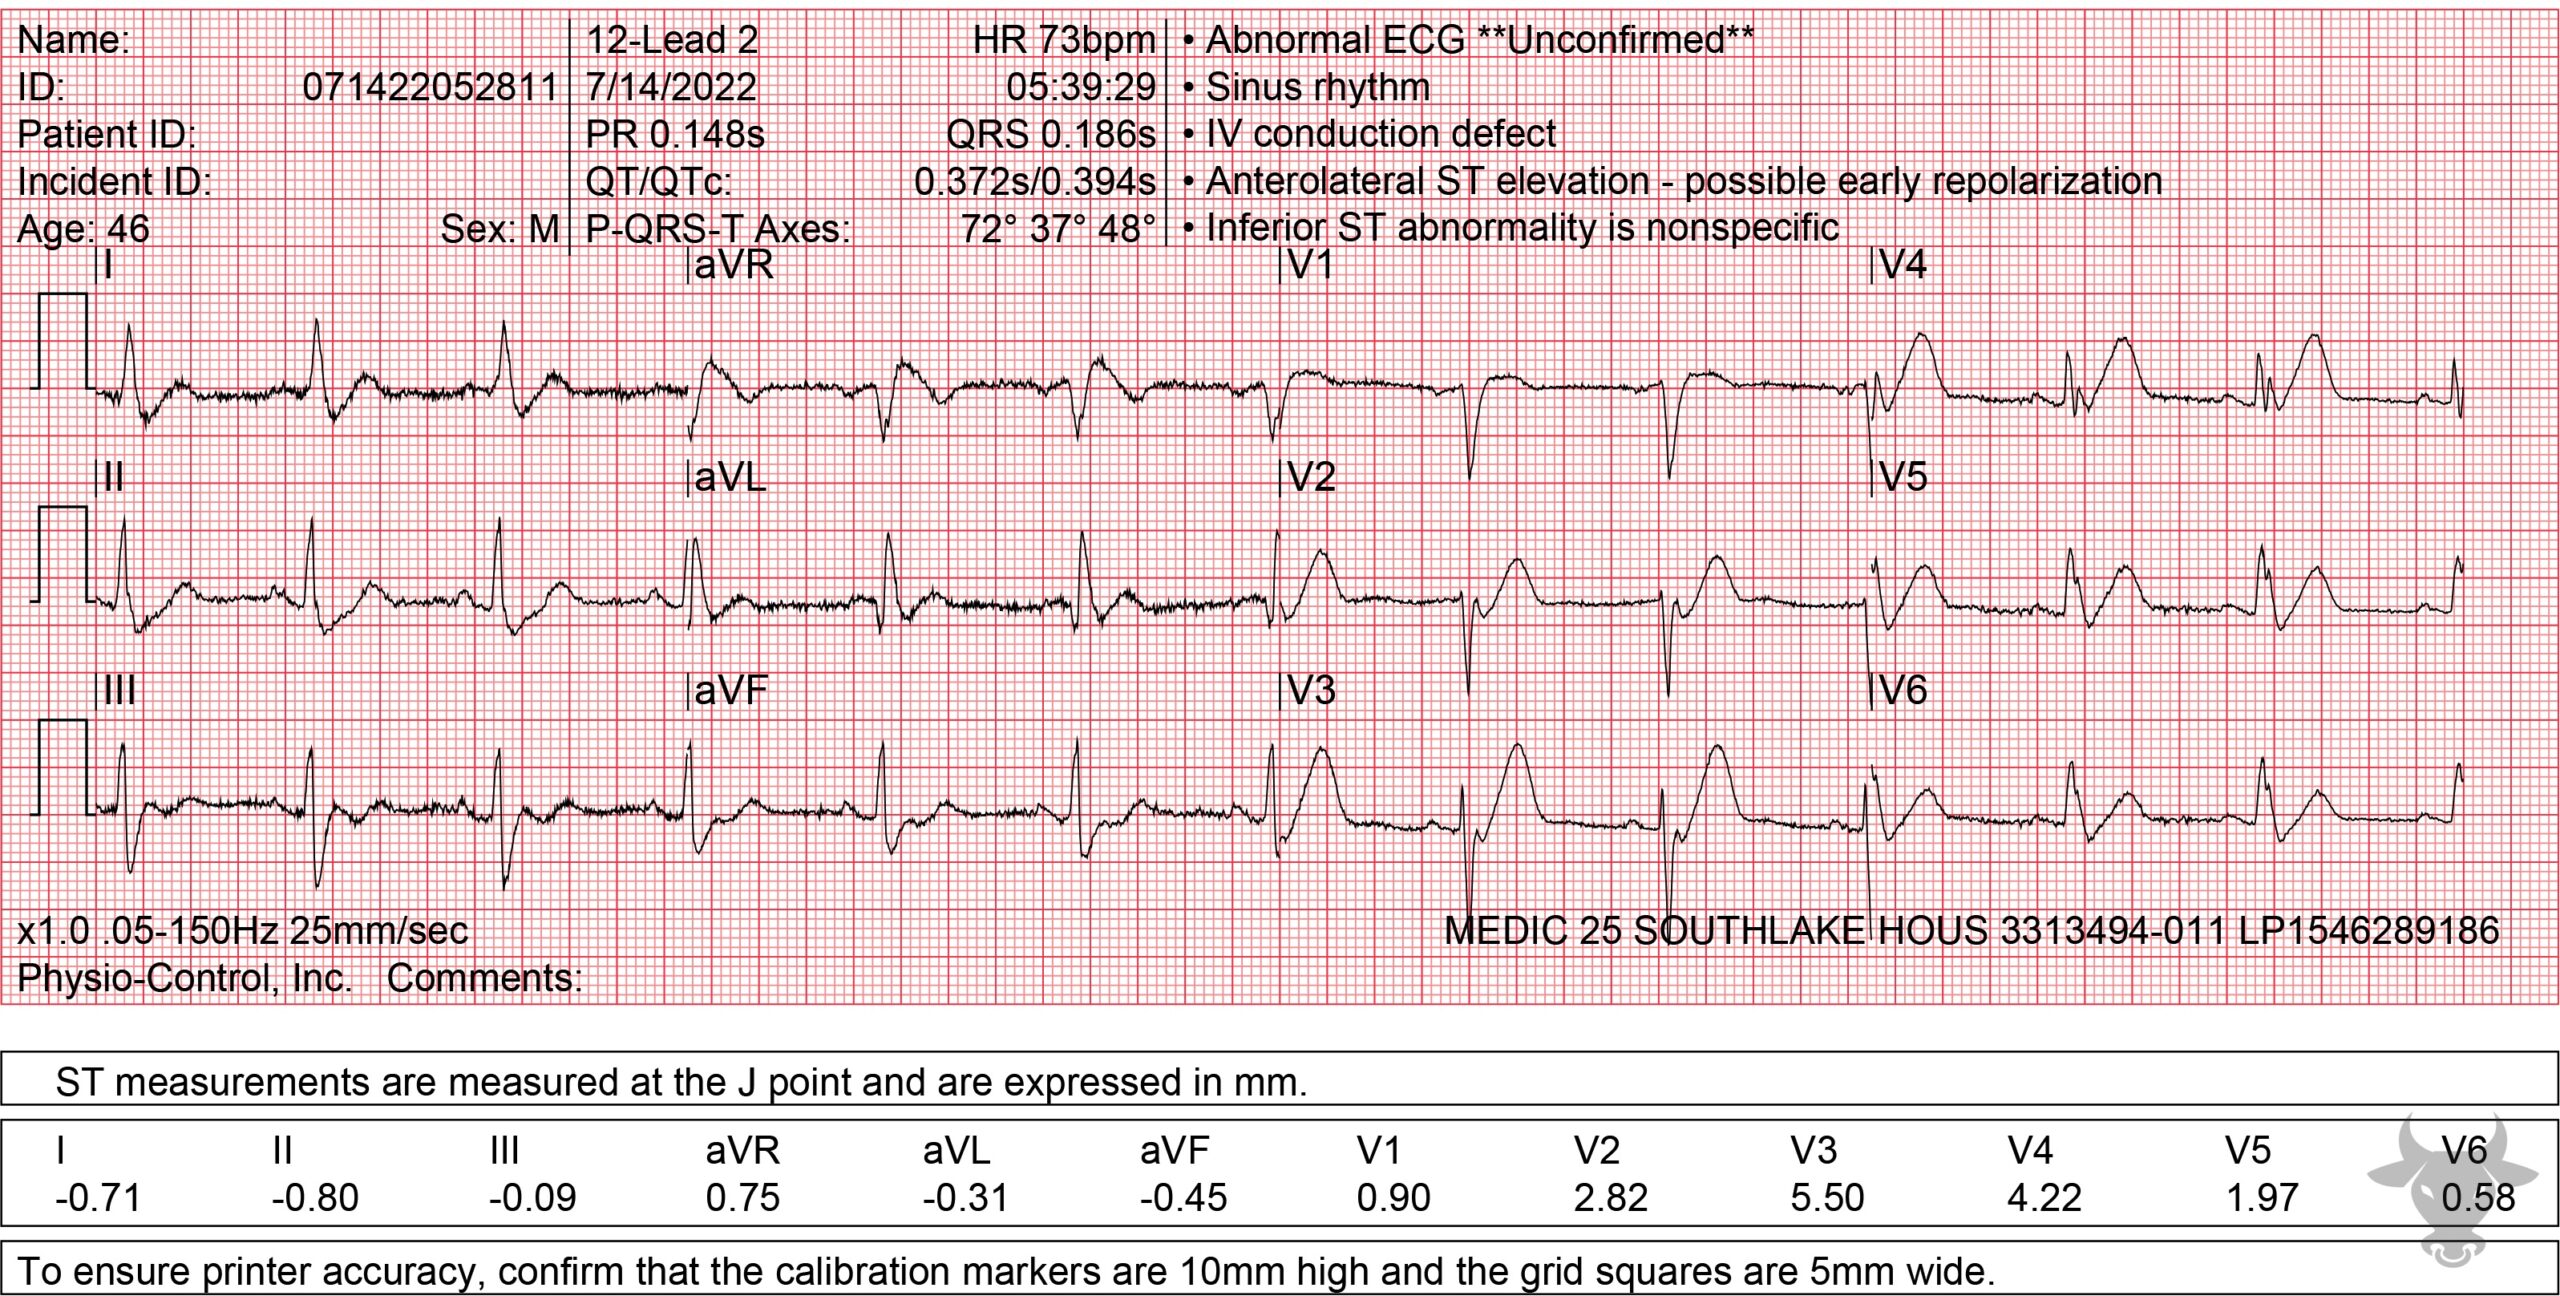
Hyperacute T Waves
Note the hyperacute 'deWinter T waves' that ultimately evolved into an anterior STEMI. Left heart catheterization showed a distal left main occlusion that was successfully stented.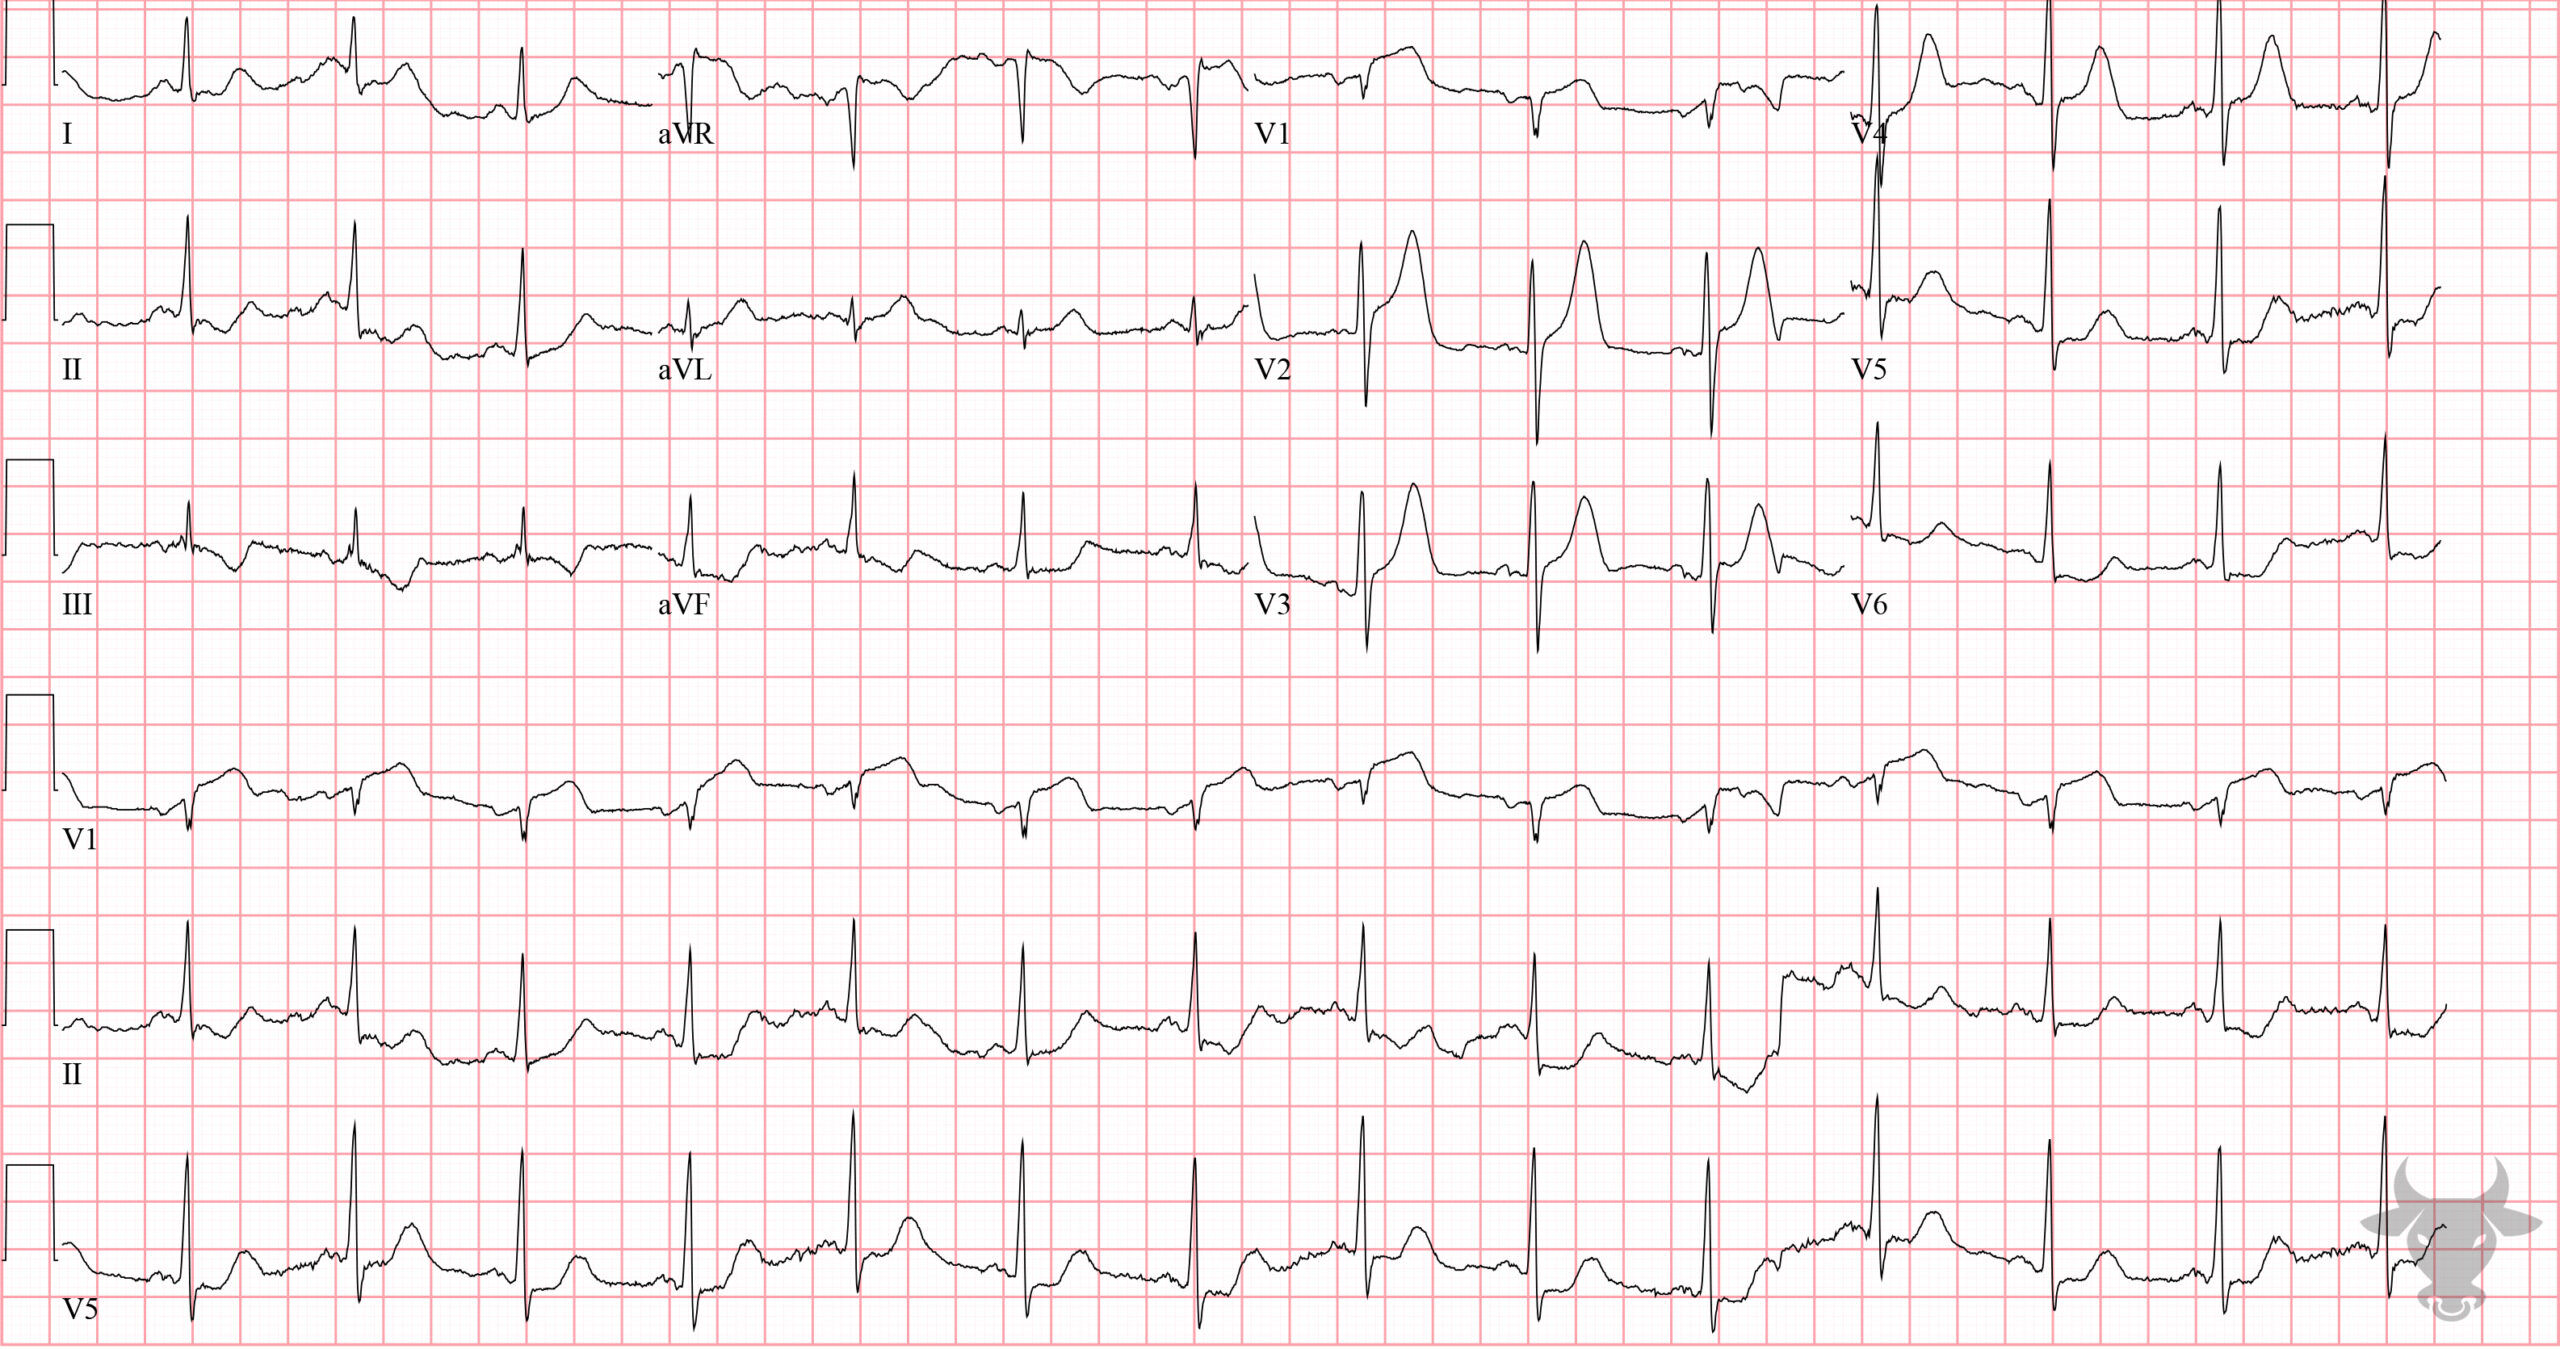
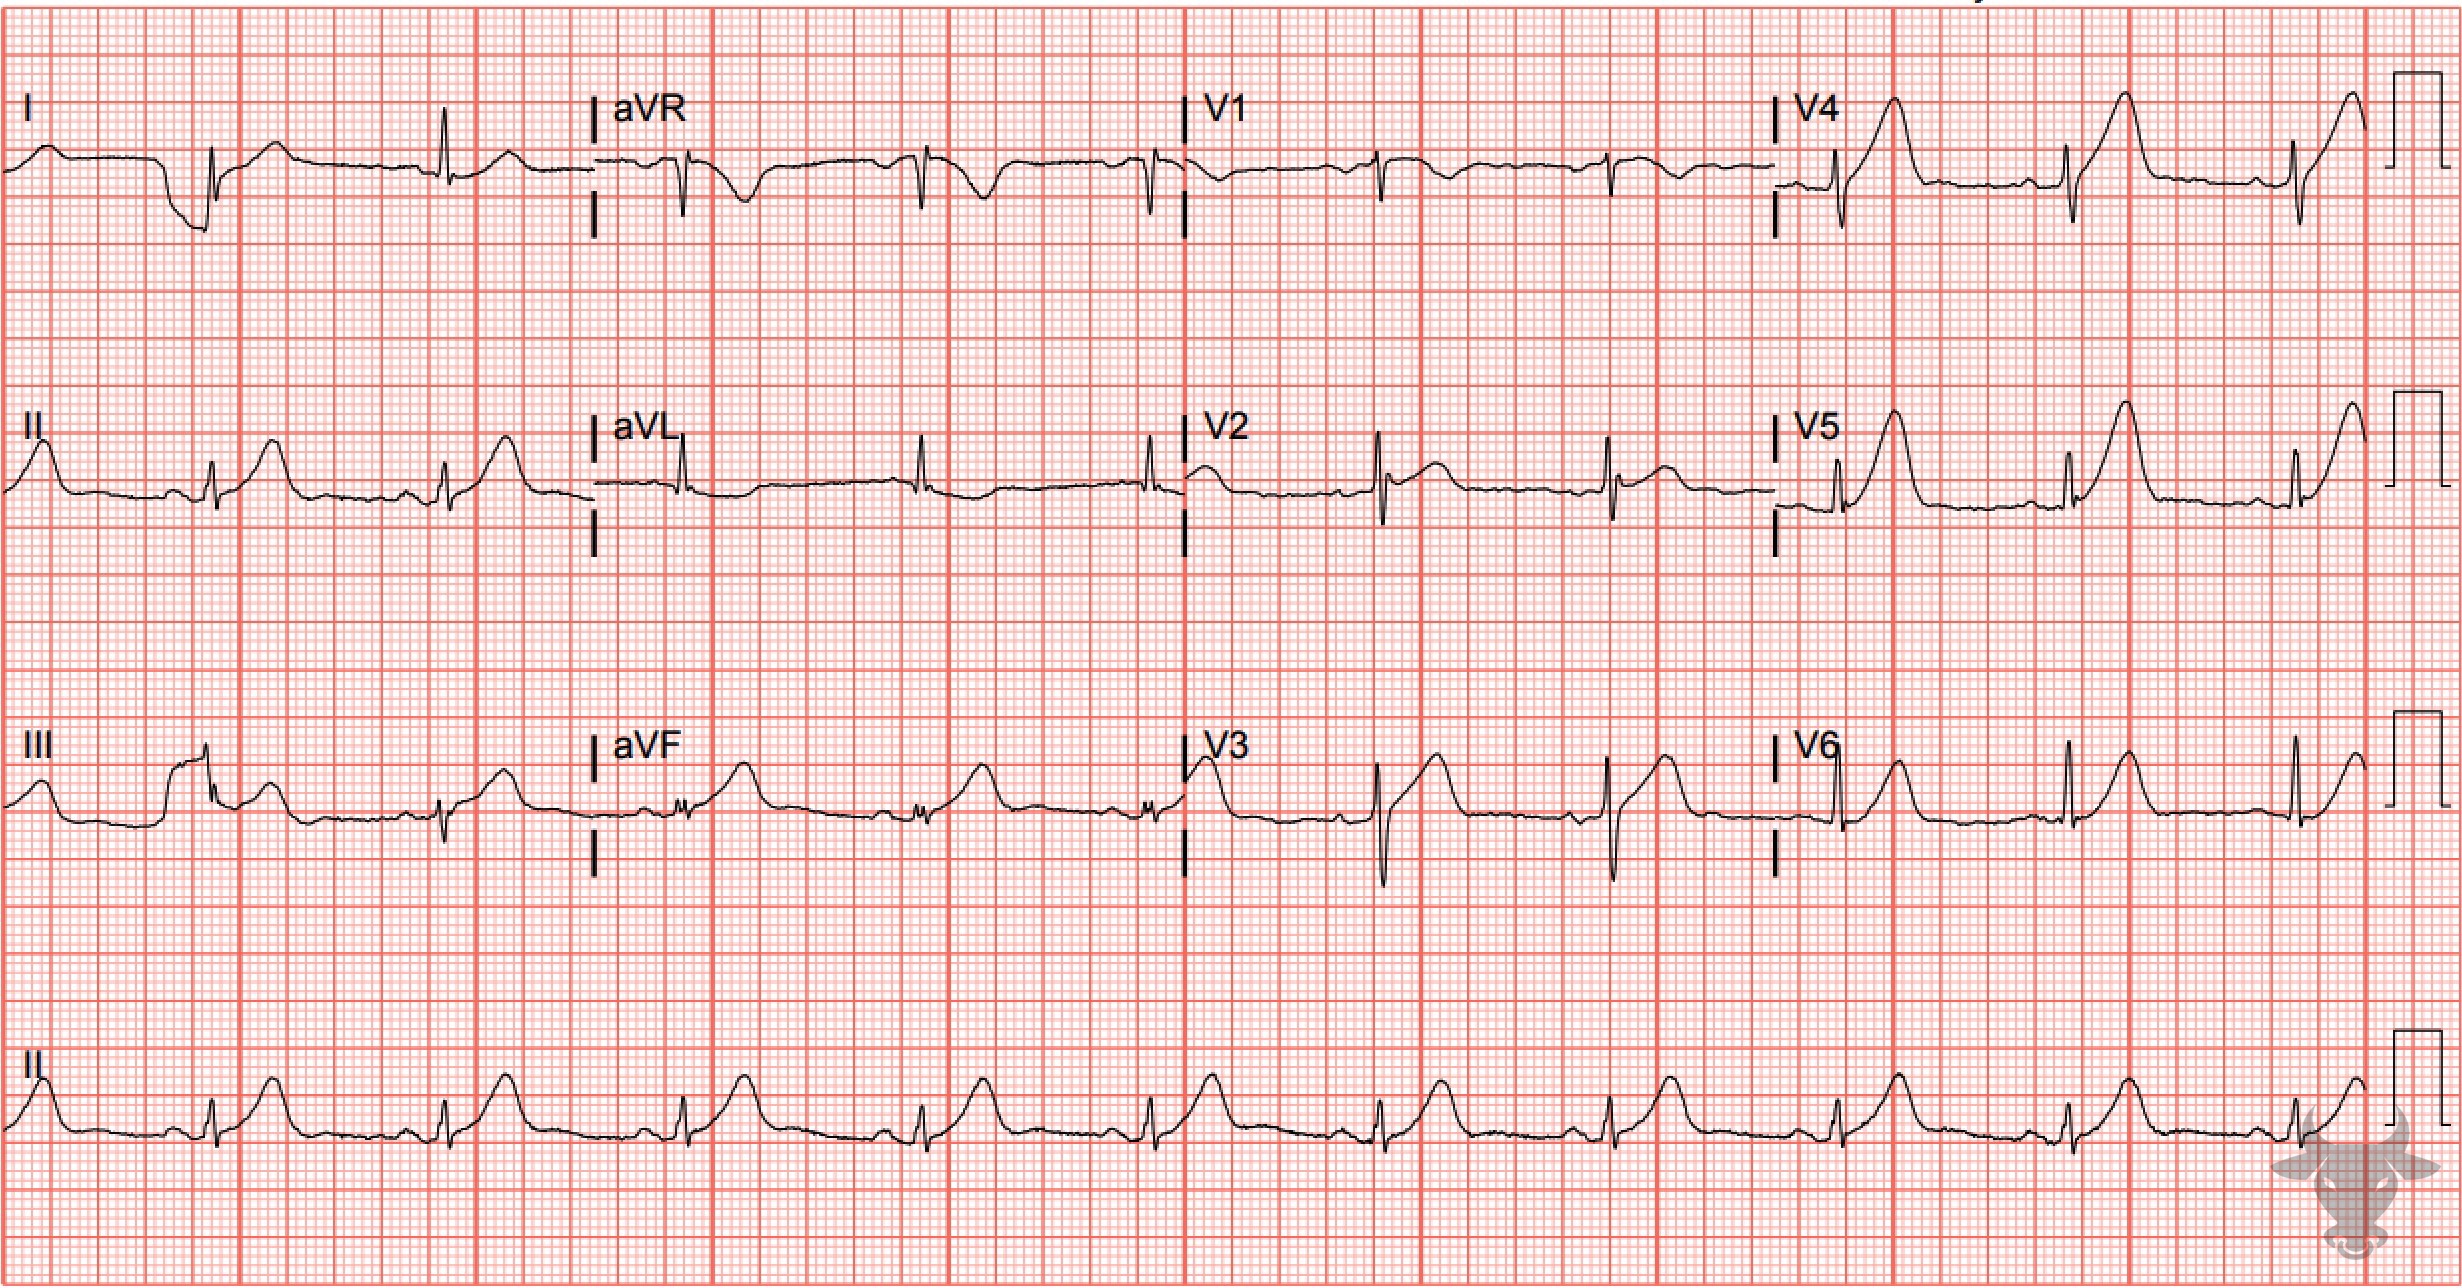
Hyperacute T Waves
The T waves in the anterior precordium approach the size of the QRS complexes, making them hyperacute. There are ST depressions in the inferolateral leads. Left heart catheterization revealed an acute left anterior descending artery occlusion.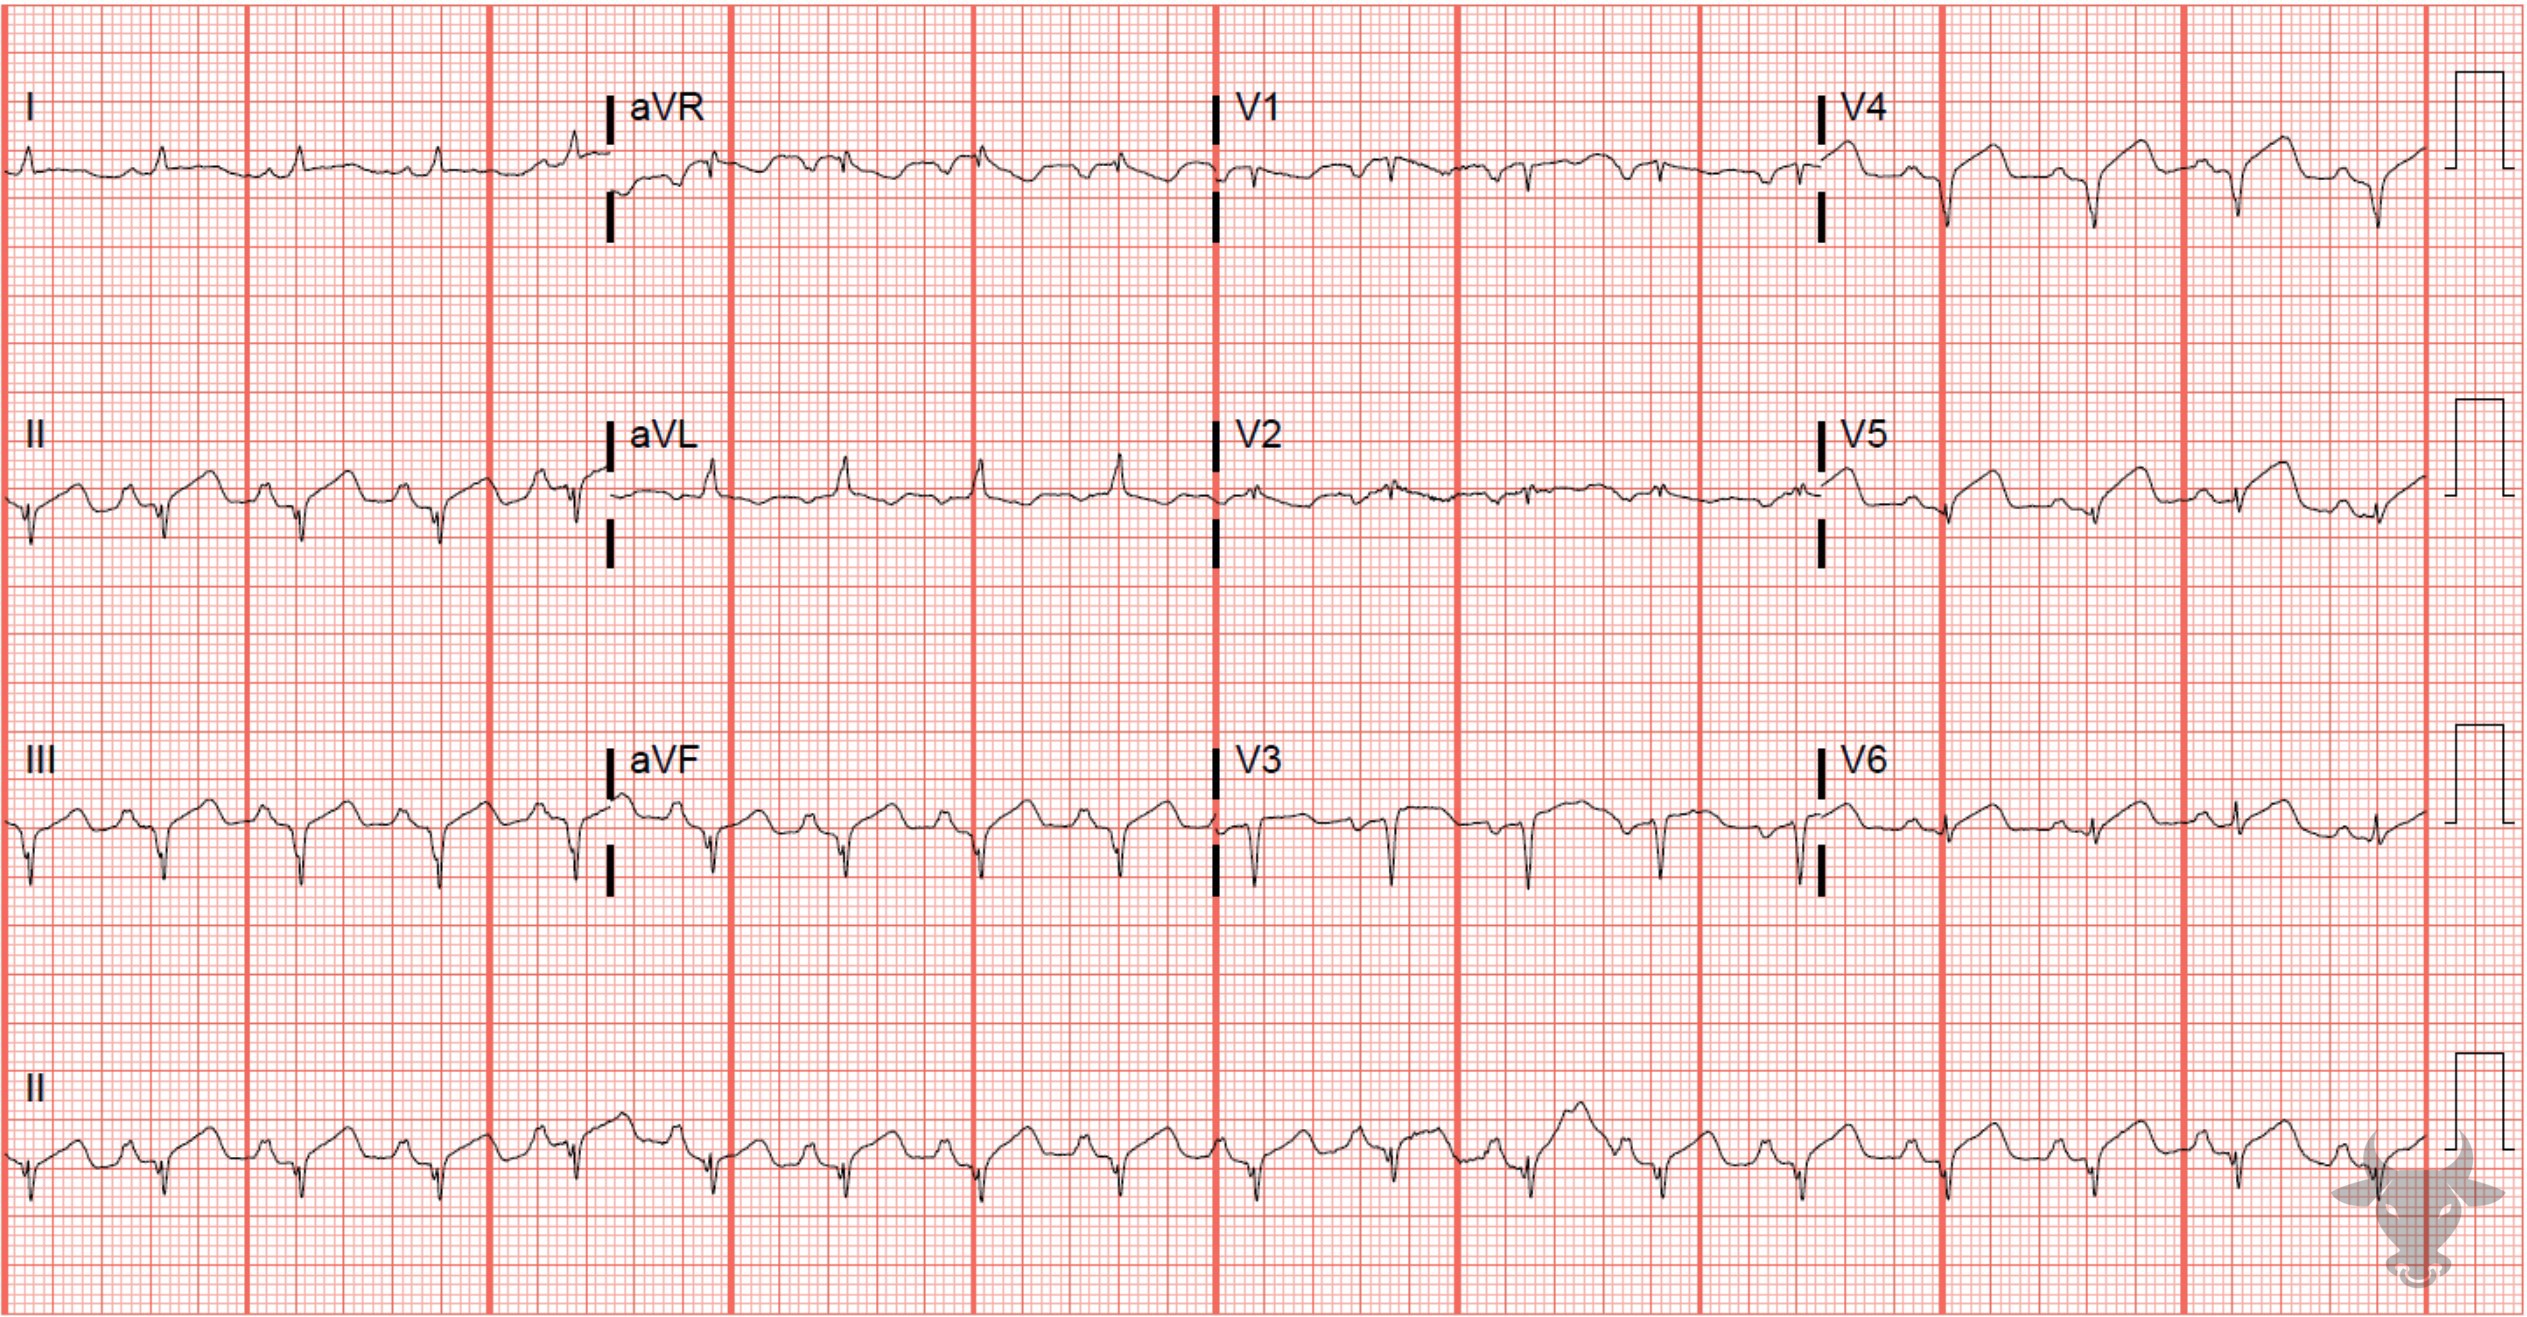
Hyperacute T Waves
While not particularly large at first glance, the T waves in V5 and V6 are larger than the amplitude of the QRS complex and, therefore, represent hyperacute T waves. This ECG evolved into a more obvious STEMI. A completely occluded left anterior descending artery was discovered on left heart catheterization.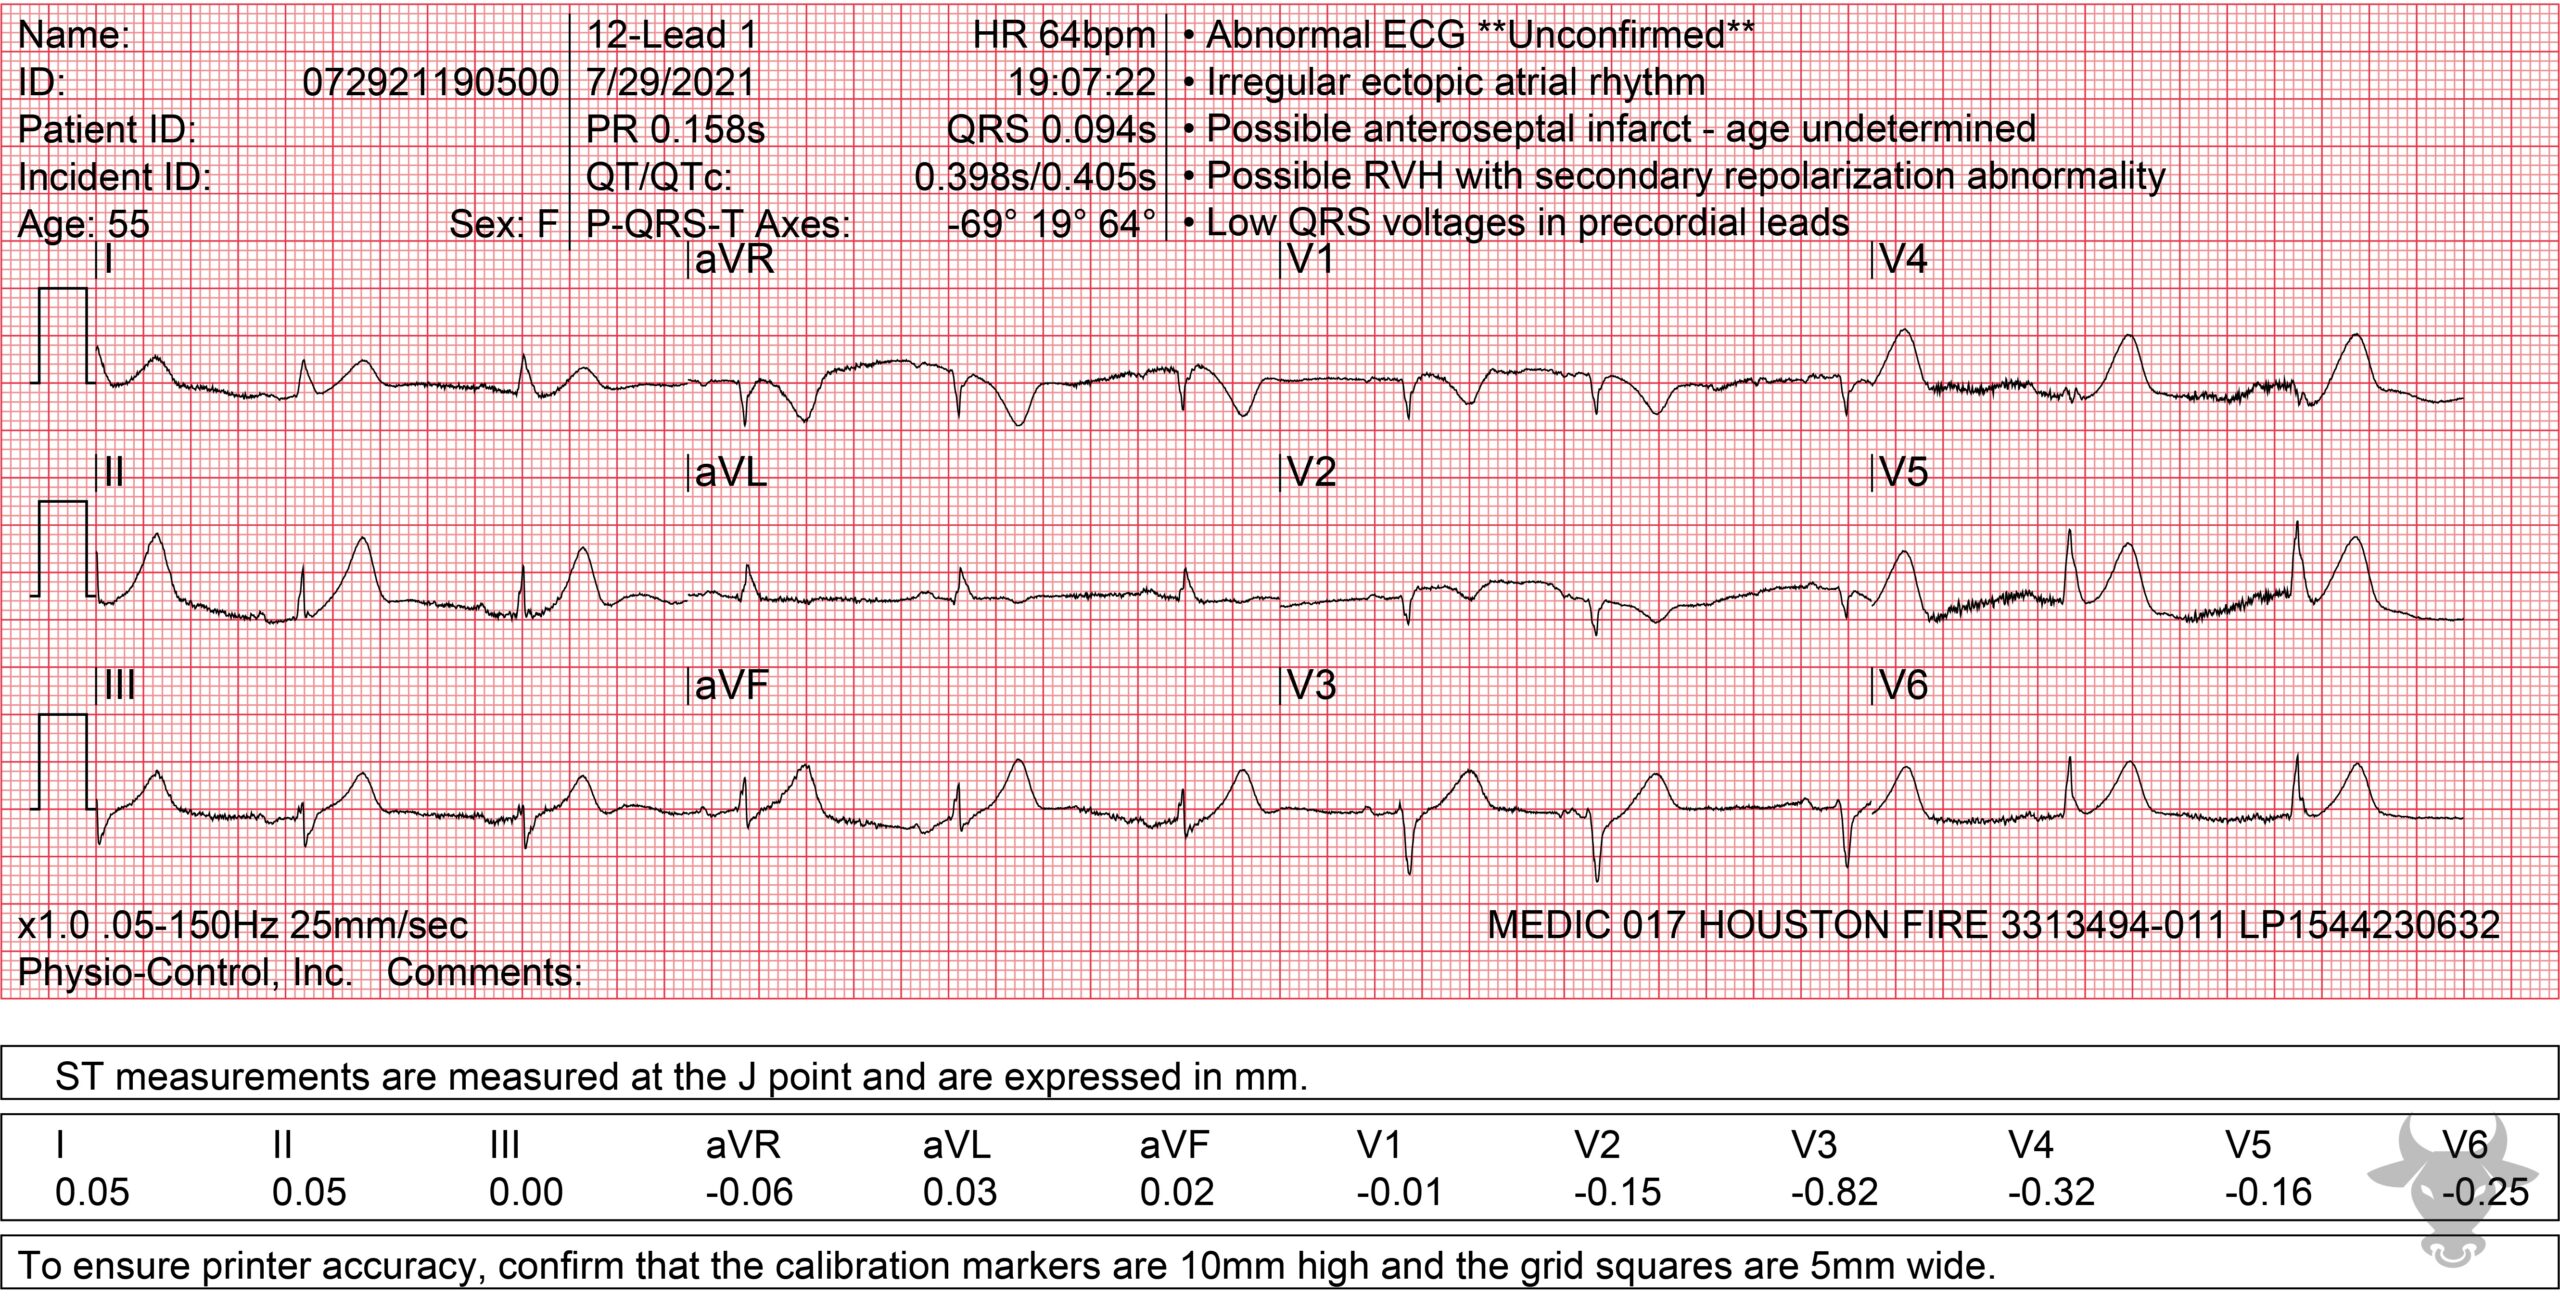
Hyperacute T Waves
Hyperacute T waves. Left heart catheterization revealed a mid-left anterior descending artery occlusion.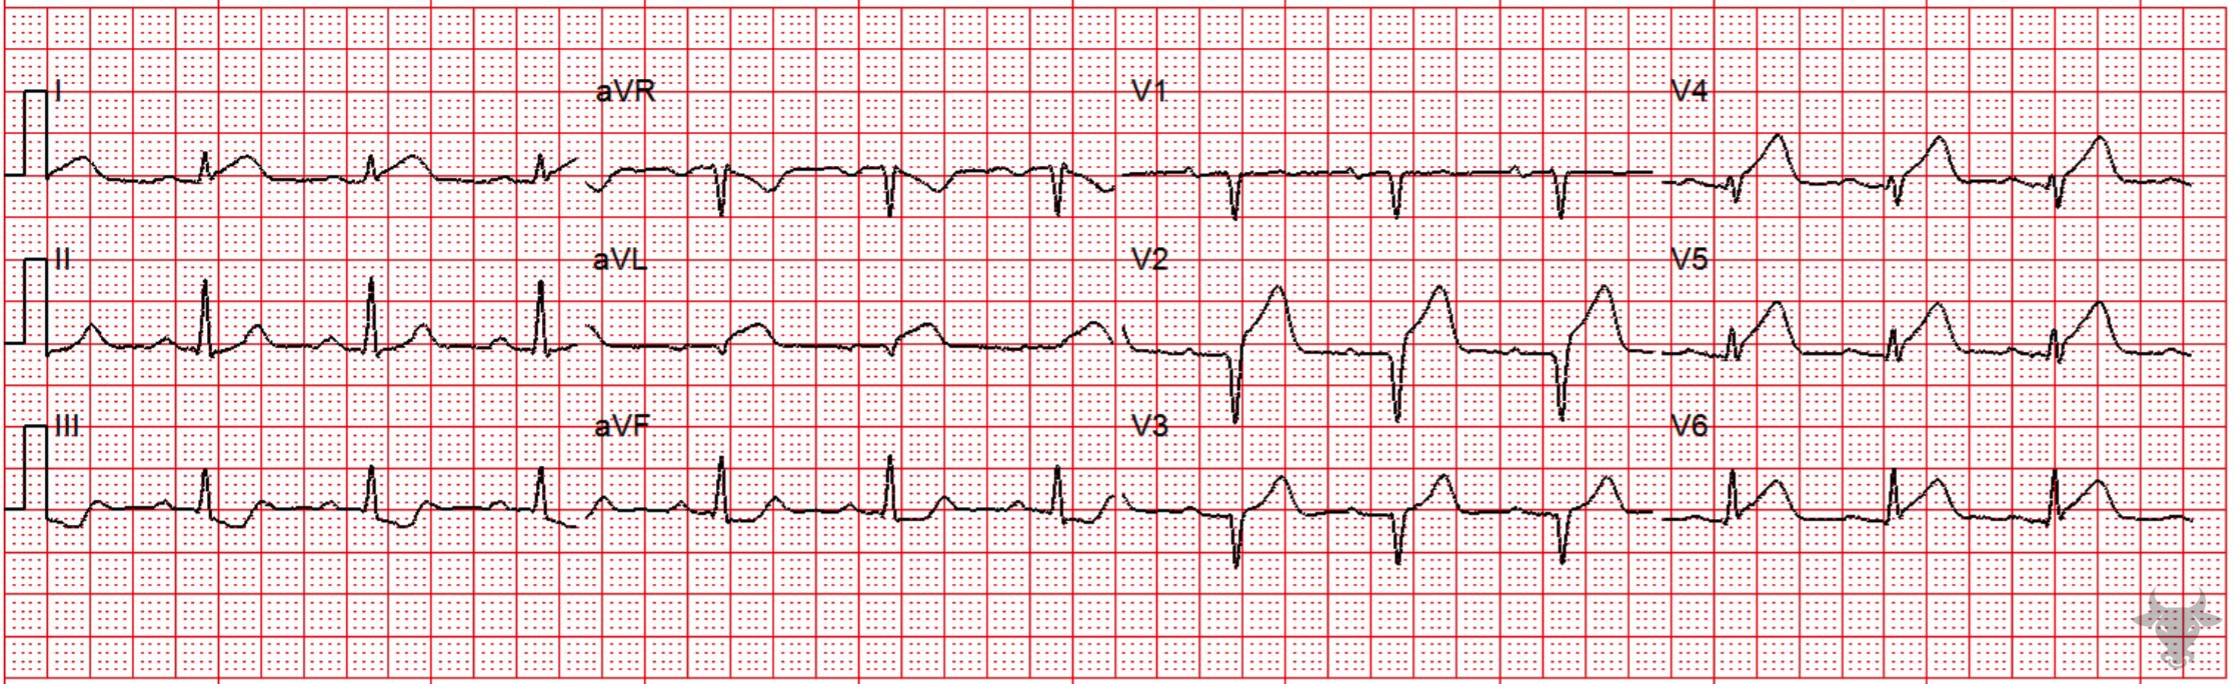
ST-elevation Myocardial Infarction
Hyperacute T waves are present in V4 and V5. Note that the amplitudes of the T waves in these leads are greater than the QRS complexes.References
- de Winter RJ, Verouden NJW, Wellens HJJ, Wilde AAM. A New ECG Sign of Proximal LAD Occlusion. New England Journal of Medicine. 2008;359(19):2071-2073.
- Goebel M, Bledsoe J, Orford JL, Mattu A, Brady WJ. A new ST-segment elevation myocardial infarction equivalent pattern? Prominent T wave and J-point depression in the precordial leads associated with ST-segment elevation in lead aVr. American Journal of Emergency Medicine. 2014;32(3):287.e5-287.e8.